

The number of dairy cows on farms in the United States is shown in Table 4 for
Question:
The number of dairy cows on farms in the United States is shown in Table 4 for selected years since 1950. Let 1940 be year 0.
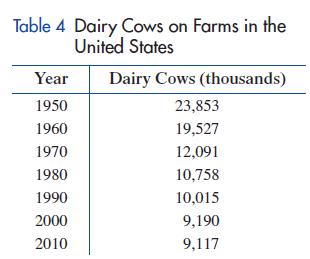
(A) Find a logarithmic regression model (y = a + b ln x) for the data. Estimate (to the nearest thousand) the number of dairy cows in 2023.
(B) Explain why it is not a good idea to let 1950 be year 0.
Fantastic news! We've Found the answer you've been seeking!
Step by Step Answer:
A Logarithmic regression mo...View the full answer

Answered By
Danish Sohail
My objective is to become most reliable expert for clients. For last 10 years I have been associated with the field of accounting and finance. My aim is to strive for best results and pay particular attention to client needs. I am always enthusiastic to help clients for issues and concerns related to business studies. I can work on analysis of the financial statements, calculate different ratios and analysis of ratios. I can critically evaluate stock prices based on the financial analysis and valuation for companies using financial statements of the business entity being valued with use of excel tools. I have expertise to provide effective and reliable help for projects in corporate finance, equity investments, financial accounting, cost accounting, financial planning, business plans, marketing plans, performance measurement, budgeting, economic research, risk assessment, risk management, derivatives, fixed income investments, taxation, auditing, and financial performance analysis.
78+ Reviews
112+ Question Solved
Related Book For 

College Mathematics For Business Economics, Life Sciences, And Social Sciences
ISBN: 978-0134674148
14th Edition
Authors: Raymond Barnett, Michael Ziegler, Karl Byleen, Christopher Stocker
Question Posted:
