

The table gives the total daily cost y (in dollars) of producing x dozen chocolate chip cookies
Question:
The table gives the total daily cost y (in dollars) of producing x dozen chocolate chip cookies at various production levels.
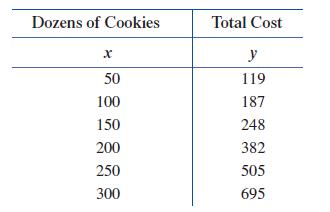
(A) Enter the data into a graphing calculator and find a quadratic regression equation for the total cost.
(B) Use the regression equation from part (A) to find the minimum average cost (to the nearest cent) and the corresponding production level (to the nearest integer).
Fantastic news! We've Found the answer you've been seeking!
Step by Step Answer:
QuadReg yax2bxc a0061285714 b1224285714 c1022 Let Cx be the ...View the full answer

Answered By
PALASH JHANWAR
I am a Chartered Accountant with AIR 45 in CA - IPCC. I am a Merit Holder ( B.Com ). The following is my educational details.
PLEASE ACCESS MY RESUME FROM THE FOLLOWING LINK: https://drive.google.com/file/d/1hYR1uch-ff6MRC_cDB07K6VqY9kQ3SFL/view?usp=sharing
3+ Reviews
10+ Question Solved
Related Book For 

College Mathematics For Business Economics, Life Sciences, And Social Sciences
ISBN: 978-0134674148
14th Edition
Authors: Raymond Barnett, Michael Ziegler, Karl Byleen, Christopher Stocker
Question Posted:
