

The total cost (in dollars) of producing x laser printers per week is shown in the figure.
Question:
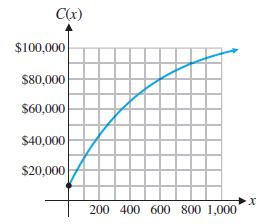
The total cost (in dollars) of producing x laser printers per week is shown in the figure. Which is greater, the approximate cost of producing the 201st printer or the approximate cost of producing the 601st printer? Does this graph represent a manufacturing process that is becoming more efficient or less efficient as production levels increase? Explain.
Fantastic news! We've Found the answer you've been seeking!
Step by Step Answer:
The approximate cost of producing the 201st printer is ...View the full answer

Answered By
Marvine Ekina
Marvine Ekina
Dedicated and experienced Academic Tutor with a proven track record for helping students to improve their academic performance. Adept at evaluating students and creating learning plans based on their strengths and weaknesses. Bringing forth a devotion to education and helping others to achieve their academic and life goals.
PERSONAL INFORMATION
Address: , ,
Nationality:
Driving License:
Hobbies: reading
SKILLS
????? Problem Solving Skills
????? Predictive Modeling
????? Customer Service Skills
????? Creative Problem Solving Skills
????? Strong Analytical Skills
????? Project Management Skills
????? Multitasking Skills
????? Leadership Skills
????? Curriculum Development
????? Excellent Communication Skills
????? SAT Prep
????? Knowledge of Educational Philosophies
????? Informal and Formal Assessments
0 Reviews
10+ Question Solved
Related Book For 

College Mathematics For Business Economics, Life Sciences, And Social Sciences
ISBN: 978-0134674148
14th Edition
Authors: Raymond Barnett, Michael Ziegler, Karl Byleen, Christopher Stocker
Question Posted:
