

The U.S. Consumer Price Index (CPI) in recent years is given in Table 3. A scatter plot
Question:
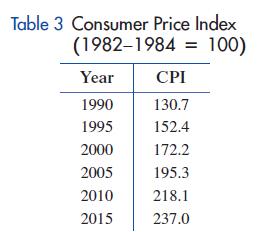
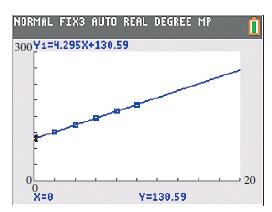
The U.S. Consumer Price Index (CPI) in recent years is given in Table 3. A scatter plot of the data and linear regression line are shown in the figure, where x represents years since 1990.
(A) Interpret the slope of the model.
(B) Predict the CPI in 2024.
Fantastic news! We've Found the answer you've been seeking!
Step by Step Answer:
From the given data we can see that the CPI value c...View the full answer

Answered By
Gloria Joseph
Hi,
I am a tutor in Mathematics subject. I love learning and teaching too. I understand that each student is unique and hence I need to change myself - while communicating with each one of the students - so as to make the activity of learning a play thing, once and then for ever!
I believe in activity-based learning, with the help of tools/games/students participating in events- especially outdoor ones. I also believe in continuous learning and teaching to keep myself up to date!
Cheers!!
0 Reviews
10+ Question Solved
Related Book For 

College Mathematics For Business Economics, Life Sciences, And Social Sciences
ISBN: 978-0134674148
14th Edition
Authors: Raymond Barnett, Michael Ziegler, Karl Byleen, Christopher Stocker
Question Posted:
