

Use the graph of f in the figure to identify the following (assume that f(0) < 0,
Question:
Use the graph of f in the figure to identify the following (assume that f″(0) < 0, f″(b) > 0, and f″(g) > 0):
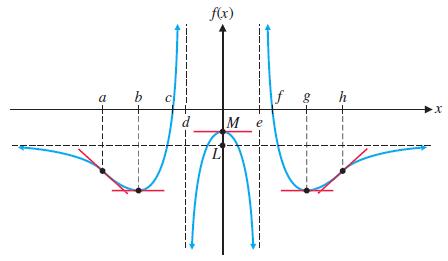
(A) The intervals on which f′(x) < 0
(B) The intervals on which f′(x) > 0
(C) The intervals on which f(x) is increasing
(D) The intervals on which f(x) is decreasing
(E) The x coordinate(s) of the point(s) where f(x) has a local maximum
(F) The x coordinate(s) of the point(s) where f(x) has a local minimum
(G) The intervals on which f″(x) < 0
(H) The intervals on which f″(x) > 0
(I) The intervals on which the graph of f is concave upward
(J) The intervals on which the graph of f is concave downward
(K) The x coordinate(s) of the inflection point(s)
(L) The horizontal asymptote(s)
(M) The vertical asymptote(s)
Step by Step Answer:

This question has not been answered yet.
You can Ask your question!


College Mathematics For Business Economics, Life Sciences, And Social Sciences
ISBN: 978-0134674148
14th Edition
Authors: Raymond Barnett, Michael Ziegler, Karl Byleen, Christopher Stocker
