

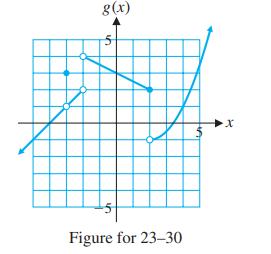
Problems 2330 refer to the function g shown in the figure. Use the graph to estimate the
Question:
Problems 23–30 refer to the function g shown in the figure. Use the graph to estimate the indicated function values and limits.
Step by Step Answer:

This question has not been answered yet.
You can Ask your question!
Related Book For 
College Mathematics For Business Economics Life Sciences And Social Sciences
ISBN: 9780321945518
13th Edition
Authors: Raymond Barnett, Michael Ziegler, Karl Byleen
Question Posted:
