

The figure contains a scatter plot of 20 data points for white pine trees and the linear
Question:
The figure contains a scatter plot of 20 data points for white pine trees and the linear regression model for this data.
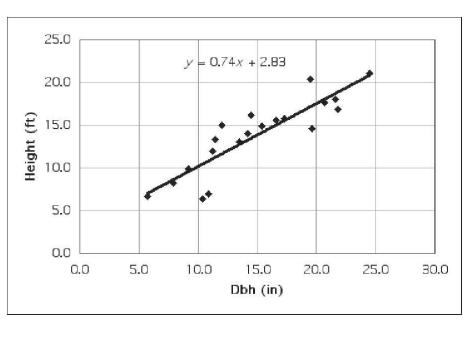
(A) Interpret the slope of the model.
(B) What is the effect of a 1-in. increase in Dbh?
(C) Estimate the height of a white pine tree with a Dbh of 25 in. Round your answer to the nearest foot.
(D) Estimate the Dbh of a white pine tree that is 15 ft tall. Round your answer to the nearest inch.
Fantastic news! We've Found the answer you've been seeking!
Step by Step Answer:
A Interpretation of the Slope of the Model The linear regression model equation is given as y 074x 2...View the full answer

Answered By
Muhammad Umair
I have done job as Embedded System Engineer for just four months but after it i have decided to open my own lab and to work on projects that i can launch my own product in market. I work on different softwares like Proteus, Mikroc to program Embedded Systems. My basic work is on Embedded Systems. I have skills in Autocad, Proteus, C++, C programming and i love to share these skills to other to enhance my knowledge too.
1+ Reviews
10+ Question Solved
Related Book For 

College Mathematics For Business Economics Life Sciences And Social Sciences
ISBN: 9780321945518
13th Edition
Authors: Raymond Barnett, Michael Ziegler, Karl Byleen
Question Posted:
