

Consider the waveform in Figure P.5.26. If it were applied to a simple DSP with the transfer
Question:
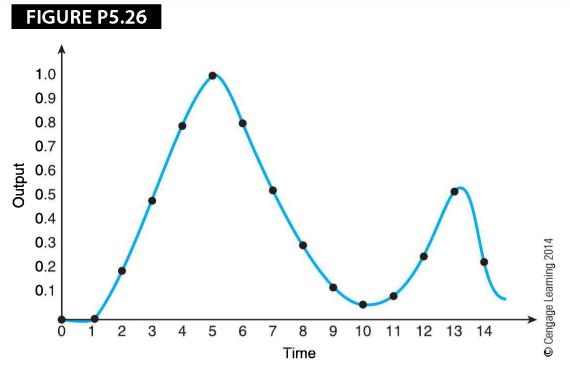
Consider the waveform in Figure P.5.26. If it were applied to a simple DSP with the transfer function y; = 0.7x; + 0.3x;_1, what would the output look like? Assume the data is 0.0, 0.0, 0.20, 0.5, 0.8, 1.0, 0.85, 0.55, 0.3, 0.15, 0.05, 0.1, 0.25, 0.50, and 0.24.
Fantastic news! We've Found the answer you've been seeking!
Step by Step Answer:
The output is given by y 07x 03X1 Yo 07 xo 03 x 07 x 0 03 x 0 00 Y 07 x 03 xo 0...View the full answer

Answered By
Sandhya Sharma
I hold M.Sc and M.Phil degrees in mathematics from CCS University, India and also have a MS degree in information management from Asian institute of technology, Bangkok, Thailand. I have worked at a international school in Bangkok as a IT teacher. Presently, I am working from home as a online Math/Statistics tutor. I have more than 10 years of online tutoring experience. My students have always excelled in their studies.
119+ Reviews
214+ Question Solved
Related Book For 

Computer Organization And Architecture Themes And Variations
ISBN: 9781111987046
1st Edition
Authors: Alan Clements
Question Posted:
