

Question: MapReduce enables large amounts of parallelism by having data-independent tasks run on multiple nodes, often using commodity hardware; however, there are limits to the level
MapReduce enables large amounts of parallelism by having data-independent tasks run on multiple nodes, often using commodity hardware; however, there are limits to the level of parallelism. For example, for redundancy MapReduce will write data blocks to multiple nodes, consuming disk and, potentially, network bandwidth. Assume a total dataset size of 300 GB, a network bandwidth of 1 Gb/s, a 10 s/GB map rate, and a 20 s/GB reduce rate. Also assume that 30% of the data must be read from remote nodes, and each output file is written to two other nodes for redundancy. Use Figure 6.6 for all other parameters.
a. Assume that all nodes are in the same rack. What is the expected runtime with 5 nodes? 10 nodes? 100 nodes? 1000 nodes? Discuss the bottlenecks at each node size.
b. Assume that there are 40 nodes per rack and that any remote read/write has an equal chance of going to any node. What is the expected runtime at 100 nodes? 1000 nodes?
c. An important consideration is minimizing data movement as much as possible. Given the significant slowdown of going from local to rack to array accesses, software must be strongly optimized to maximize locality.
Assume that there are 40 nodes per rack, and 1000 nodes are used in the MapReduce job. What is the runtime if remote accesses are within the same rack 20% of the time? 50% of the time? 80% of the time?
d. Given the simple MapReduce program in Section 6.2, discuss some possible optimizations to maximize the locality of the workload.
Section 6.2,
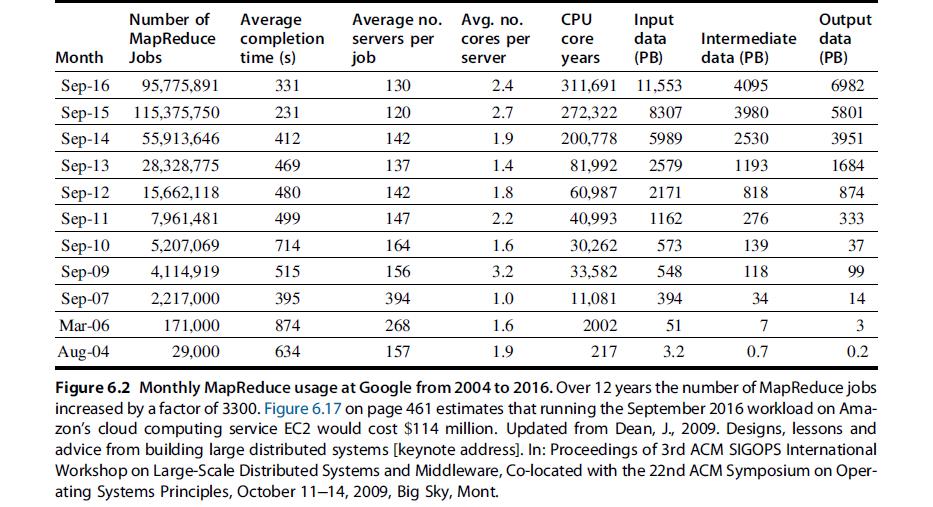
Number of Average MapReduce Month Jobs Sep-16 95,775,891 Sep-15 115,375,750 Sep-14 55,913,646 Sep-13 28,328,775 Sep-12 15,662,118. Sep-11 7,961,481 Sep-10 5,207,069 Sep-09 4,114,919 Sep-07 2,217,000 Mar-06 171,000 Aug-04 29,000 completion time (s) 331 231 412 469 480 499 714 515 395 874 634 Average no. servers per job 130 120 142 137 142 147 164 156 394 268 157 Avg. no. cores per server 2.4 2.7 1.9 1.4 1.8 2.2 1.6 3.2 1.0 1.6 1.9 CPU Input data core years (PB) 311,691 11,553 272,322 8307 200,778 5989 81,992 2579 60,987 2171 40,993 1162 30,262 573 33,582 548 11,081 394 2002 51 217 3.2 Intermediate data (PB) 4095 3980 2530 1193 818 276 139 118 34 7 0.7 Output data (PB) 6982 5801 3951 1684 874 333 37 99 14 3 0.2 Figure 6.2 Monthly MapReduce usage at Google from 2004 to 2016. Over 12 years the number of MapReduce jobs increased by a factor of 3300. Figure 6.17 on page 461 estimates that running the September 2016 workload on Ama- zon's cloud computing service EC2 would cost $114 million. Updated from Dean, J., 2009. Designs, lessons and advice from building large distributed systems [keynote address]. In: Proceedings of 3rd ACM SIGOPS International Workshop on Large-Scale Distributed Systems and Middleware, Co-located with the 22nd ACM Symposium on Oper- ating Systems Principles, October 11-14, 2009, Big Sky, Mont.
Step by Step Solution
3.40 Rating (153 Votes )
There are 3 Steps involved in it
Based on the question and the information provided we can attempt to calculate the expected runtime of a MapReduce job given different numbers of nodes and scenarios However please note that Figure 66 ... View full answer

Get step-by-step solutions from verified subject matter experts