

Question: Consider the TCP trace in Figure 6.29. Identify time intervals representing slow start on startup, slow start after timeout, and linearincrease congestion avoidance. Explain what
Consider the TCP trace in Figure 6.29. Identify time intervals representing slow start on startup, slow start after timeout, and linearincrease congestion avoidance. Explain what is going on from T =
0.5 to T = 1.9. The TCP version that generated this trace includes a feature absent from the TCP that generated Figure 6.11. What is this feature? This trace and the one in Figure 6.13 both lack a feature.
What is it?
Figure 6.29)
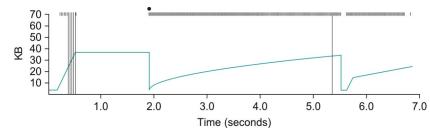
Figure 6.11)
Figure 6.13)
KB 70 60 50 40 30 20 10 1.0 2.0 3.0 4.0 Time (seconds) 5.0 6.0 7.0
Step by Step Solution
There are 3 Steps involved in it
The images provided appear to be TCP throughput graphs which are used to analyze the performance of TCP Transmission Control Protocol over a period of ... View full answer

Get step-by-step solutions from verified subject matter experts