

The accompanying graph (Figure P8.8) is a costvolumeprofit graph, In the graph, identify the following line segments
Question:
The accompanying graph (Figure P8.8) is a cost—volume—profit graph, In the graph, identify the following line segments or points.
(a) Line EF represents
(b) The horizontal axis AB represents ______. and the vertical axis AD represents
(c) Point V represents _____.
(d) The distance CB divided by the distance AB is _______
(e) The point Vb is a break-even _____.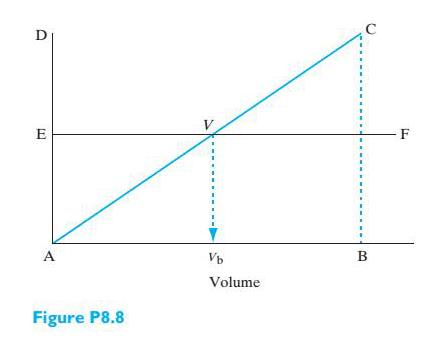
Fantastic news! We've Found the answer you've been seeking!
Step by Step Answer:
a Total fixed cost to ...View the full answer

Answered By
BRIAN MUSINGA
I possess a Bachelors of Commerce degree(Marketing option) and am currently undertaking an MBA in marketing. I believe that I possess the required knowledge and skills to tutor in the subject named. I have also written numerous research academic papers much to the satisfaction of clients and my professors.
2+ Reviews
17+ Question Solved
Related Book For 
Question Posted:
