

Question: Using the data contained in Figure 2.3, what 52-week rate of return, excluding dividend yields, would an investor have received by purchasing the following portfolios
Using the data contained in Figure 2.3, what 52-week rate of return, excluding dividend yields, would an investor have received by purchasing the following portfolios of stocks?
a. The stocks in the Dow Jones Industrial Average
b. The stocks in the New York Stock Exchange Composite Average
c. The stocks in the NASDAQ 100 Average
d. The stocks in the Russell 2000 Index
Assume that you purchased the stocks in the various averages in the same proportions that they are in the averages.
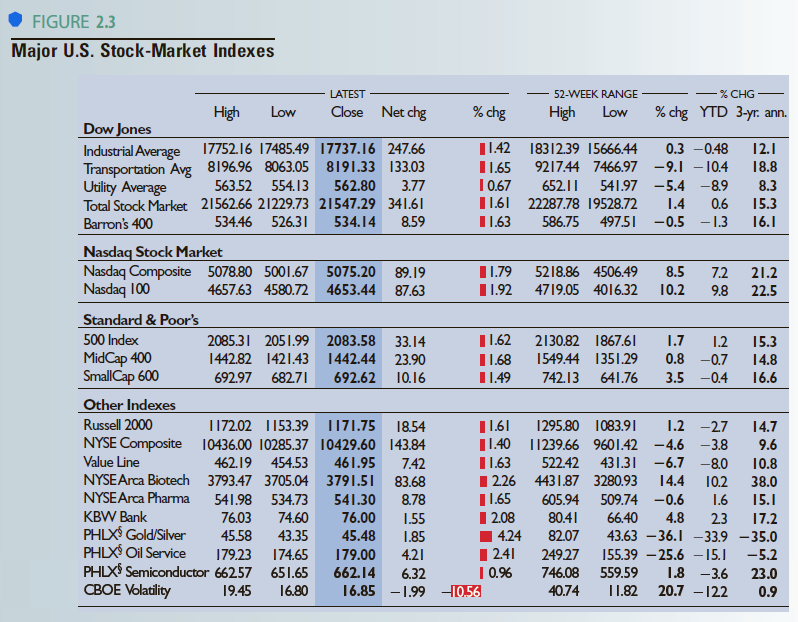
FIGURE 2.3 Major U.S. Stock-Market Indexes - 52-WEEK RANGE LATEST % CHG- Close Net chg High % chg % chg YTD 3-yr. ann. Low High Low Dow Jones Industrial Average Transportation Avg 8196.96 8063.05 8191.33 133.03 Utility Average Total Stock Market 21562.66 21229.73 21547.29 341.61 1142 18312.39 15666.44 12.1 18.8 17752.16 17485.49 17737.16 247.66 0.3 -0.48 1.65 1 0.67 1.61 22287.78 19528.72 9217.44 7466.97 -9.1 10.4 3.77 652.11 563.52 554.13 562.80 541.97 -5.4 -8.9 8.3 1.4 497.51 -0.5 1.3 0.6 15.3 534.46 526.31 534.14 8.59 I1.63 586.75 16.1 Barron's 400 Nasdaq Stock Market Nasdaq Composite 5078.80 5001.67 5075.20 Nasdaq 100 11.79 5218.86 4506.49 8.5 21.2 22.5 89.19 7.2 10.2 4657.63 4580.72 4653.44 87.63 I1.92 4719.05 4016.32 9.8 Standard & Poor's 500 Index |162 15.3 14.8 2085.31 2051.99 2083.58 2130.82 1867.61 1.7 33.14 1.2 MidCap 400 SmallCap 600 1442.44 23.90 0.8 -0.7 1442.82 1421.43 1549.44 1351.29 I1.68 149 692.62 10.16 641.76 692.97 682.71 742.13 3.5 -0.4 16.6 Other Indexes 1161 1295.80 1083.91 11.40 11239.66 9601.42 -4.6 -3.8 11.63 1 226 4431.87 3280.93 1.2 -27 Russell 2000 1172.02 1153.39 1I71.75 1854 NYSE Composite 10436.00 10285.37 10429.60 143.84 7.42 83.68 8.78 14.7 9.6 Value Line 431.31 -6.7 -8.0 462.19 454.53 461.95 522.42 10.8 NYSEArca Biotech 3793.47 3705.04 3791.51 14.4 10.2 38.0 NYSEArca Pharma I1.65 I 2.08 1 4.24 1241 | 0.% H0,56 15.1 541.98 534.73 541.30 605.94 509.74 -0.6 1.6 KBW Bank 74.60 80.41 76.03 76.00 17.2 43.63 -36.1 33.9 -35.0 66.40 4.8 1.55 2.3 PHLX Gold/Silver PHLX Oil Service PHLXS Semiconductor 66257 CBOE Volatility 45.58 43.35 45.48 82.07 1.85 155.39 25.6 15.J 1.8 -3.6 20.7 -122 179.23 174.65 179.00 4.21 249.27 -5.2 559.59 651.65 662.14 746.08 6.32 23.0 19.45 16.80 16.85 -1.99 40.74 11.82 0.9
Step by Step Solution
3.41 Rating (160 Votes )
There are 3 Steps involved in it
Returns over ... View full answer

Get step-by-step solutions from verified subject matter experts