

Question: Note down the changes in the EUs population highlighted by Figures 13.1 and 13.2. i. How are these predicted changes likely to impact upon the
Note down the changes in the EU’s population highlighted by Figures 13.1 and 13.2.
i. How are these predicted changes likely to impact upon the composition of the labour force in relation to full- and part-time work, age and gender?
ii. What implications do you consider these change are likely to have for SHRP
(strategic human resource planning)?
iii. What other demographic changes do you predict based upon your own knowledge of labour markets.
Figure 13.1:
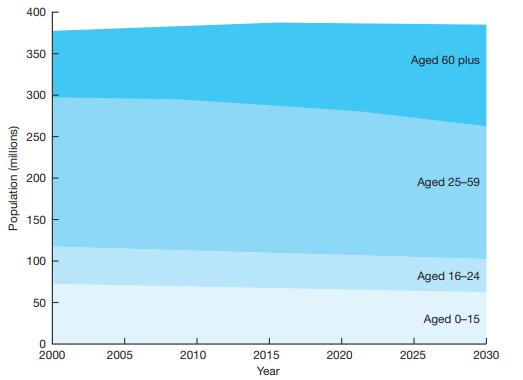
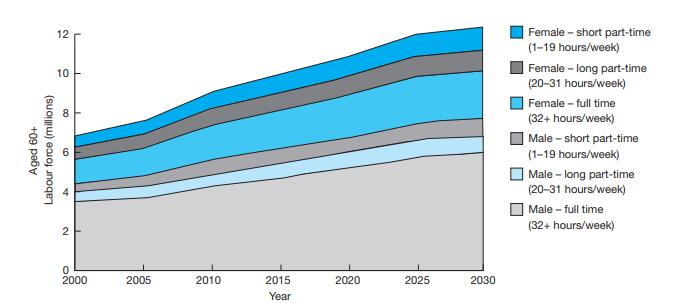
Figure 13.2:
Population (millions) 400 350 300 250 200 150 100 50 0 2000 2005 2010 2015 Year 2020 Aged 60 plus Aged 25-59 Aged 16-24 Aged 0-15 2025 2030
Step by Step Solution
3.30 Rating (147 Votes )
There are 3 Steps involved in it
To address these questions we first need to examine the changes in the EUs population highlighted by Figures 131 and 132 Since youve mentioned only Fi... View full answer

Get step-by-step solutions from verified subject matter experts