

Question: Given the data in Table A, complete the labor demand schedule shown in Table B. Contrast this schedule to the value of marginal product schedule
Given the data in Table A, complete the labor demand schedule shown in Table B. Contrast this schedule to the value of marginal product schedule that would exist given these data. Explain why the labor demand and VMP schedules differ.
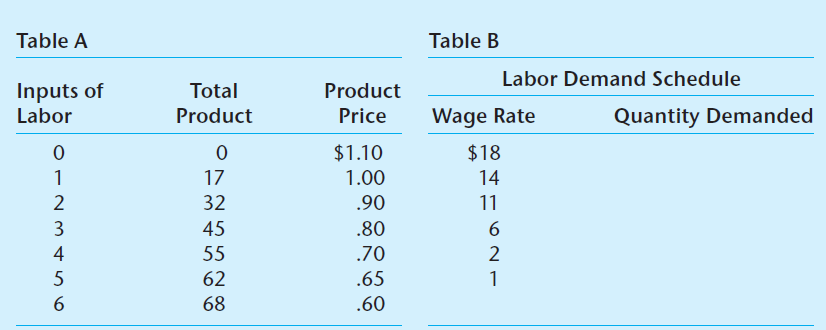
Table A Table B Labor Demand Schedule Total Product Inputs of Labor Product Quantity Demanded Price Wage Rate $1.10 $18 17 1.00 14 32 45 .90 11 3 .80 4 55 .70 62 .65 68 .60
Step by Step Solution
★★★★★
3.43 Rating (166 Votes )
There are 3 Steps involved in it
1 Expert Approved Answer
Step: 1 Unlock

Wage Quantity ... View full answer
Question Has Been Solved by an Expert!
Get step-by-step solutions from verified subject matter experts
Step: 2 Unlock
Step: 3 Unlock