

Question: 2. Based on the output, a. What is the area under the ROC curve? How would you grade this area in terms of the discriminatory
2. Based on the output,
a. What is the area under the ROC curve? How would you grade this area in terms of the discriminatory power of the model being fitted?
b. In the output provided under the heading “Association of Predicted Probabilities and Observed Responses,” the number of pairs is 38,198. How is this number computed?
c. In the output provided under the same heading in question 2b, how are the Percent Concordant and the Percent Tied computed?
d. Using the information given by the number of pairs, the Percent Concordant and the Percent Tied described in parts
(b) and (c), compute the area under the ROC curve (AUC) and verify that it is equal to your answer to part 2a.
e. The ROC curves for the interaction model described above and the no interaction model that does not contain the CC or CH (interaction) variables are shown below. The area under the ROC curve for the no-interaction model is 0.705. Why is the latter AUC less than the AUC for the interaction model?
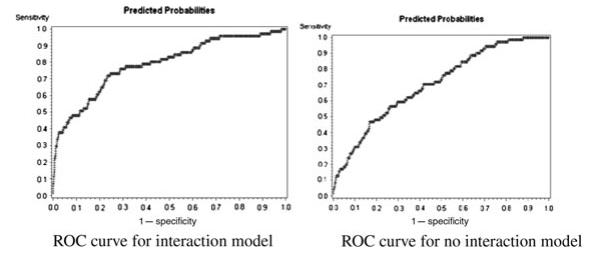
Predicted Probabilities Sensitivty Predicted Probabilities 10 Seravity 10 09 09 08 08 07 07 06 06 05 05 04 04 03 03 02 01 00 00 01 02 03 04 05 06 07 08 09 10 1-specificity ROC curve for interaction model 07 01 03 01 02 03 04 05 06 07 08 09 10 1-specificity ROC curve for no interaction model
Step by Step Solution
There are 3 Steps involved in it

Get step-by-step solutions from verified subject matter experts