

Question: Make a bar chart to visualize these responses. A sample of students at a large university were asked whether they were full-time students living on
Make a bar chart to visualize these responses.
A sample of students at a large university were asked whether they were full-time students living on campus (Full-Time Residential, FTR), full-time students who commuted (FTC), or part-time students (PT). The raw data are in the table below:
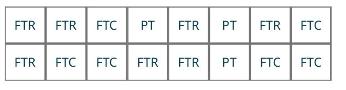
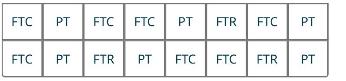
FTR FTR FTC PT FTR PT FTR FTC FTR FTC FTC FTR FTR H PT FTC FTC
Step by Step Solution
There are 3 Steps involved in it
1 Expert Approved Answer
Step: 1 Unlock

Question Has Been Solved by an Expert!
Get step-by-step solutions from verified subject matter experts
Step: 2 Unlock
Step: 3 Unlock