

Question: Make a stem-and-leaf plot of the data. Employees at a college help desk track the number of people who request assistance each week. The table
Make a stem-and-leaf plot of the data.
Employees at a college help desk track the number of people who request assistance each week. The table gives a sample of the results:
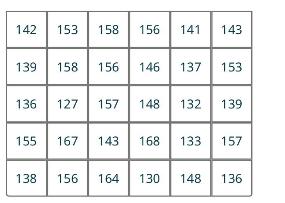
142 153 158 156 141 143 139 158 156 146 137 153. 136 127 157 148 132 139 155 167 143 168 133 157 138 156 164 130 148 136
Step by Step Solution
There are 3 Steps involved in it
1 Expert Approved Answer
Step: 1 Unlock

Question Has Been Solved by an Expert!
Get step-by-step solutions from verified subject matter experts
Step: 2 Unlock
Step: 3 Unlock