

Question: The graph shown represents the graph of a function: a. True b. False -10-8-6-4-20 4 2 10 8 6 2 4 6 8 10 -2
The graph shown represents the graph of a function:
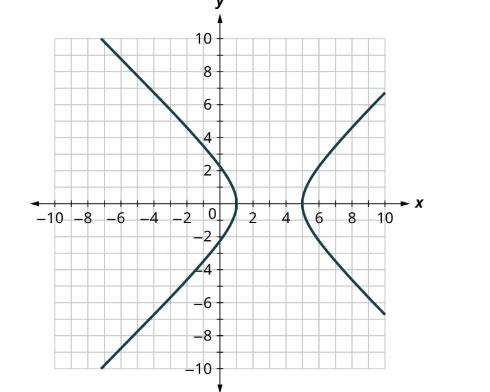
a. True
b. False
-10-8-6-4-20 4 2 10 8 6 2 4 6 8 10 -2 24 -6 -8 -10
Step by Step Solution
★★★★★
3.36 Rating (165 Votes )
There are 3 Steps involved in it
1 Expert Approved Answer
Step: 1 Unlock

Question Has Been Solved by an Expert!
Get step-by-step solutions from verified subject matter experts
Step: 2 Unlock
Step: 3 Unlock