

Question: This graph shows three distributions, all with mean 2 . What are their standard deviations? Figure 8.40 4 -2 0 2 60 8 10 10
This graph shows three distributions, all with mean 2 . What are their standard deviations?
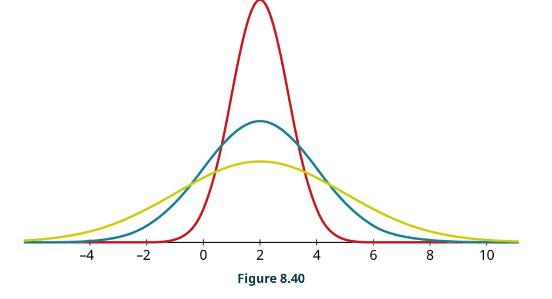
Figure 8.40 4 -2 0 2 60 8 10 10
Step by Step Solution
There are 3 Steps involved in it
1 Expert Approved Answer
Step: 1 Unlock

Question Has Been Solved by an Expert!
Get step-by-step solutions from verified subject matter experts
Step: 2 Unlock
Step: 3 Unlock