

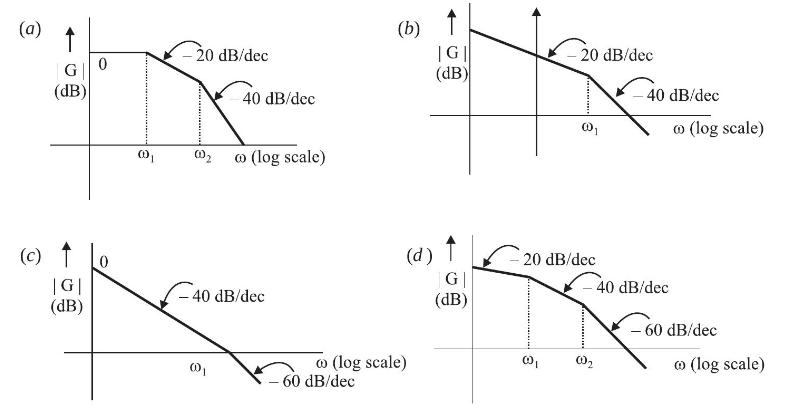
Question: The Nyquist plot for a control system is shown below. The Bode plot for the same system will be (0=0 Im (10) = Re
The Nyquist plot for a control system is shown below. The Bode plot for the same system will be
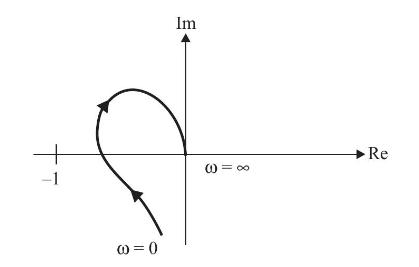
(0=0 Im (10) = Re
Step by Step Solution
★★★★★
3.34 Rating (157 Votes )
There are 3 Steps involved in it
1 Expert Approved Answer
Step: 1 Unlock

To deduce the Bode plot from the given Nyquist plot we must interpret the characteristics of the Nyquist plot and then predict what this implies for t... View full answer
Question Has Been Solved by an Expert!
Get step-by-step solutions from verified subject matter experts
Step: 2 Unlock
Step: 3 Unlock