Figure P6.14 is a simplified and linearized block diagram of a cascade control system, which is used
Question:
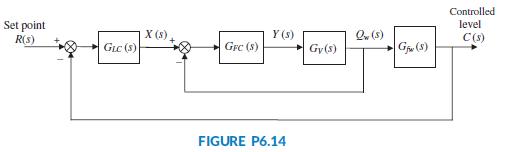
Figure P6.14 is a simplified and linearized block diagram of a cascade control system, which is used to control water level in a steam generator of a nuclear power plant (Wang, 2009).
In this system, the level controller, GLC(s), is the master controller and the feed-water flow controller, GFC(s), is the slave controller. Using mass balance equations, the water level would ordinarily be regarded as a simple integration process of water flow. In a steam generator, however, steam flow rate and the cooling effect of feed-water change the dynamics of that process. Taking the latter into account and ignoring the much-less pronounced impact of changes in steam flow rate, a first order lag plus time delay is introduced into the transfer function, Gfw(s), relating the controlled level, C(s), to feed-water flow rate, Qw(s) as follows:
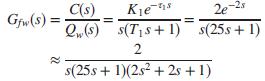
where K1 = 2 is the process gain, τ1 = 2 is the pure time delay, and T1 = 25 is the steam generator’s time constant. (The expression e-τ1s represents a time delay.
This function can be represented by what is known as a Pade approximation. This approximation can take on many increasingly complicated forms, depending upon the degree of accuracy required. Here we use the Pade approximation, and specific numerical values for the considered steam generator.)
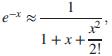
The dynamic characteristics of the control valve are approximated by the transfer function
![]()
where Kv is the valve gain and Tv is its time constant.
Given that: GFC(s) = KPFC + KDFC s = 0.5 + 2s and GLC(s) = KPLC + KDLC s = 0.5 + Ks, use the Routh-Hurwitz criterion to find the range of the level controller’s derivative gain, KDLC = K > 0, that will keep the system stable.
Step by Step Answer: