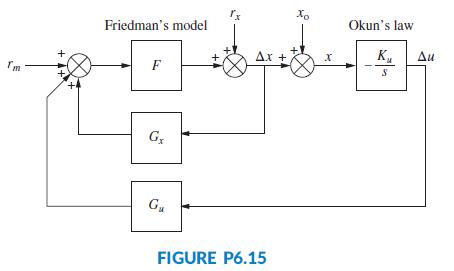
Figure P6.15 shows the model of the dynamics of an economic system (Wingrove, 2012). In this diagram
Question:
Figure P6.15 shows the model of the dynamics of an economic system (Wingrove, 2012). In this diagram x represents the rate of growth in real Gross National Product (GNP), x0 the long-term trend (dc value) of the GNP, Δx the change over the long-term trend of the GNP, rx the real and psychological disturbance inputs that affect the economy, rm the random monetary inputs, and Δu fluctuations in unemployment rate. The diagram has two feedback loops: one through Friedman’s model in which the economy dynamics are approximated by
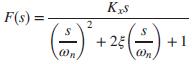
and a second loop through Okun’s law that relates the GNP to unemployment changes. Assuming the following parameter values: Kx = 2years, ωn = 1.5rad/year, ζ = 0:8, Ku = 0:4 and Gx = -0.4. Find the range of Gu for closed loop stability.
Step by Step Answer: