

Look at Table 10.1 and Figure 10.7 in the text. When were T-bill rates at their highest
Question:
Look at Table 10.1 and Figure 10.7 in the text. When were T-bill rates at their highest over the period from 1926 through 2020? Why do you think they were so high during this period? What relationship underlies your answer?
Table 10.1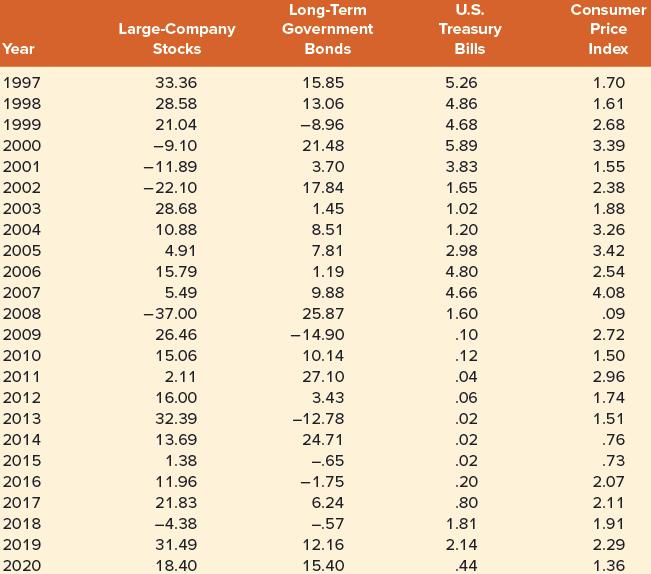
Figure 10.7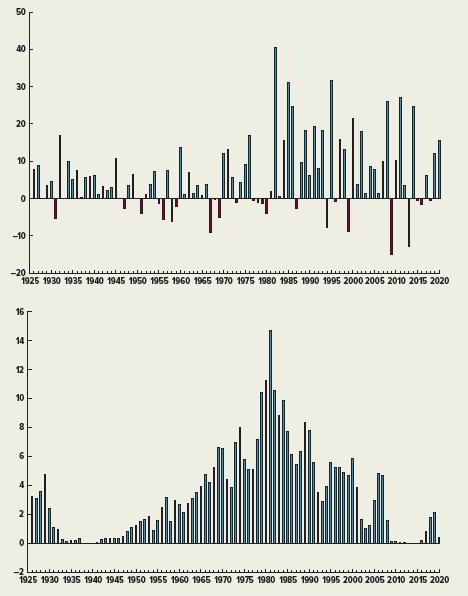
Fantastic news! We've Found the answer you've been seeking!
Step by Step Answer:

Answered By
Ishrat Khan
Previously, I have worked as an accounting scholar at acemyhomework, and have been tutoring busines students in various subjects, mostly accounting. More specifically I'm very knowledgeable in accounting subjects for college and university level. I have done master in commerce specialising in accounting and finance as well as other business subjects.
134+ Reviews
426+ Question Solved
Related Book For 
Corporate Finance
ISBN: 9781265533199
13th International Edition
Authors: Stephen Ross, Randolph Westerfield, Jeffrey Jaffe
Question Posted:
