

You have been at your job for West Coast Yachts for a week now and have decided
Question:
You have been at your job for West Coast Yachts for a week now and have decided you need to sign up for the company’s retirement plan. Even after your discussion with Sarah Brown, the Skandla Financial Services representative, you are still unsure which investment option you should choose. Recall that the options available to you are owning shares of West Coast Yachts, the Skandla Market Index Fund, the Skandla Large Company Equity Fund, the Skandla Small-Cap Fund, the Skandla Bond Fund, and the Skandla Money Market Fund. You have decided that you should invest in a diversified portfolio, with 70 per cent of your investment in equity, 25 per cent in bonds, and 5 per cent in the money market fund. You have also decided to focus your equity investment on large-cap company shares, but you are debating whether to select the Market Index Fund or the Large-Company Equity Fund.
In thinking it over, you understand the basic difference in the two funds. One is a purely passive fund that replicates a widely followed large-cap index, the FTSE 100, and has low fees. The other is actively managed with the intention that the skill of the portfolio manager will result in improved performance relative to an index. Fees are higher in the latter fund.
You are just not certain which way to go, so you ask Dan Ervin, who works in the company’s finance area, for advice.
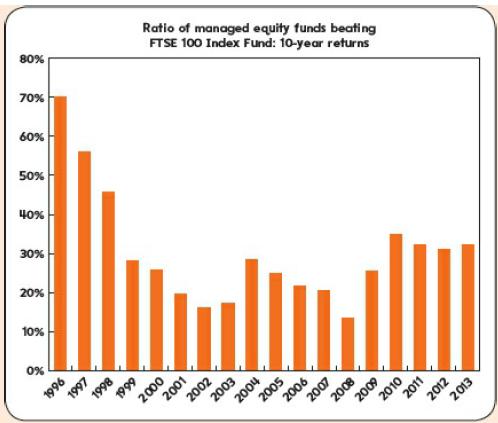
After discussing your concerns, Dan gives you some information comparing the performance of equity mutual funds and the FTSE 100 Index Fund. The FTSE 100 Index Fund replicates the FTSE 100, and its return is only negligibly different from the Index itself. Fees are very low. As a result, the FTSE 100 Index Fund is essentially identical to the Skandla Market Index Fund offered in the retirement plan, but it has been in existence for much longer, so you can study its track record for over two decades. The graph shown summarizes Dan’s comments by showing the percentage of equity mutual funds that outperformed the FTSE 100 Index Fund over the previous 10 years. So for example, from January 2001 to December 2001, about 20 per cent of equity mutual funds outperformed the FTSE 100 Index Fund. Dan suggests that you study the graph and answer the following questions:
1. What implications do you draw from the graph for mutual fund investors?
2. Is the graph consistent or inconsistent with market efficiency? Explain carefully.
3. What investment decision would you make for the equity portion of your retirement account? Why?
Step by Step Answer:
Implications of the Graph for Mutual Fund Investors Based on the graph showing the percentage of equity mutual funds outperforming the FTSE 100 Index Fund over the past 10 years we can draw several ke...View the full answer


Corporate Finance
ISBN: 9780077173630
3rd Edition
Authors: David Hillier, Stephen A. Ross, Randolph W. Westerfield, Bradford D. Jordan, Jeffrey F. Jaffe
