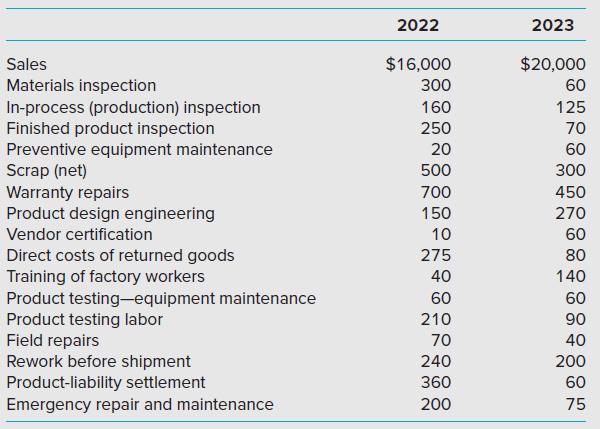
Use the data in Problem 17-70 to respond to the requirements that follow. Required 1. If you
Question:
Use the data in Problem 17-70 to respond to the requirements that follow.
Required
1. If you haven’t done so already (in conjunction with Problem 17-70), prepare in Excel a COQ report for 2022 and 2023. Show subtotals each year for each of the four COQ categories. As well, show category costs each year as a percentage of revenue for the year. Finally, show each year total COQ as a percentage of revenue for the year. and set up a spreadsheet for this information. Round all percentages to 2 decimal places.
2. Move to another area of your spreadsheet and title the area “Cost of Quality—Trend Analysis.” Show, for both 2022 and 2023, COQ spending (both category-level and in total) as a percentage of sales for the year. Show all percentages to 2 decimal places.
3. Create a bar chart to compare the percentages of each of the COQ categories and the total COQ for 2023 vs. 2022.
4. Do a sensitivity analysis by making the following (joint) changes to the 2023 amounts:
∙ Increase the total sales by 5%.
∙ Increase total prevention cost by 6%.
∙ Decrease total internal failure cost by 60%.
∙ Decrease total external failure cost by 50%.
For each of the four COQ categories, what is the revised (i.e, 2023) category cost as a percentage of sales, rounded to 2 decimal places?
Problem 17-70

Step by Step Answer:


