

Question: (LO 6-3, LO 6-4) Use the following data to graph the sales revenue and net income for Walmart from 20122020 in Excel. Create a bar
(LO 6-3, LO 6-4) Use the following data to graph the sales revenue and net income for Walmart from 2012–2020 in Excel. Create a bar graph for sales revenue, and create a line graph for net income, formatting the x- and y-axes with year and numbers inserting appropriate chart titles. What trends do you see for Walmart sales and Walmart net income over this time period? The data file, Walmart Trend Analysis.xls, is available in Connect or via the Additional Student Resources page. (Note the data is in $ millions.)
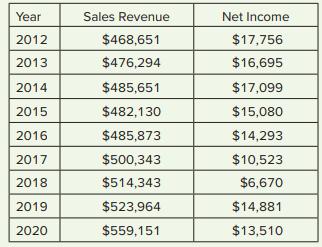
Year Sales Revenue Net Income 2012 $468,651 $17,756 2013 $476,294 $16,695 2014 $485,651 $17,099 2015 $482,130 $15,080 2016 $485,873 $14,293 2017 $500,343 $10,523 2018 $514,343 $6,670 2019 $523,964 $14,881 2020 $559,151 $13,510
Step by Step Solution
There are 3 Steps involved in it

Get step-by-step solutions from verified subject matter experts