

Question: Rewrite the pond life program from Figure 13.10 so that the output is presented as a graph in an applet window. The applet can use
Rewrite the pond life program from Figure 13.10 so that the output is presented as a graph in an applet window. The applet can use most of the same graphing techniques as the fractal applet from page 426 in Chapter 8. You should use different colors for graphing the populations of the weeds and the fish.
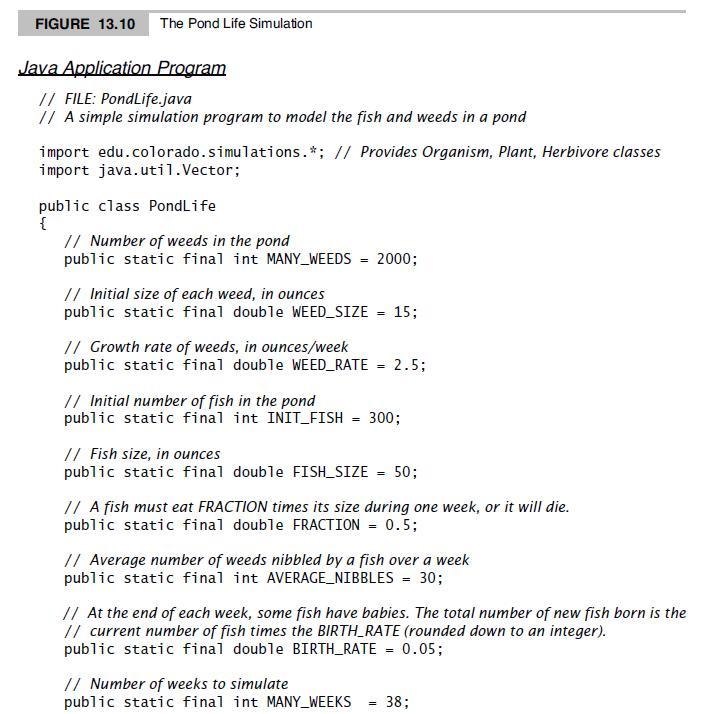
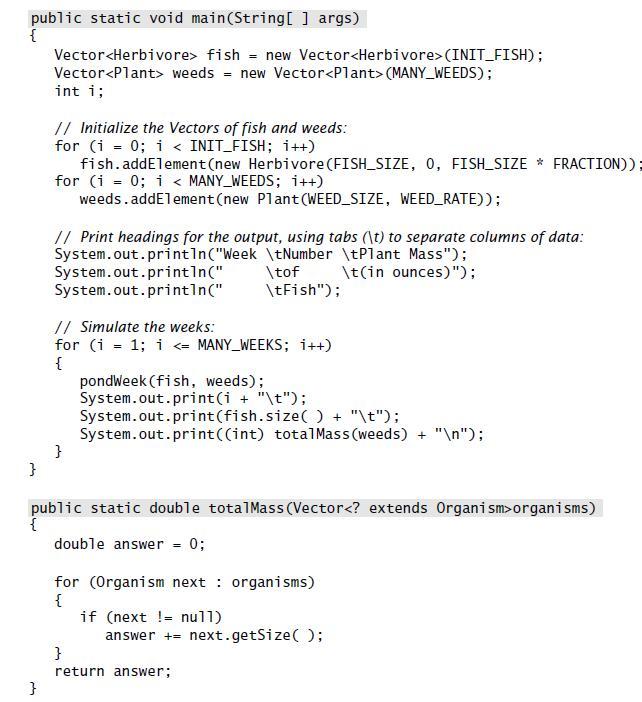
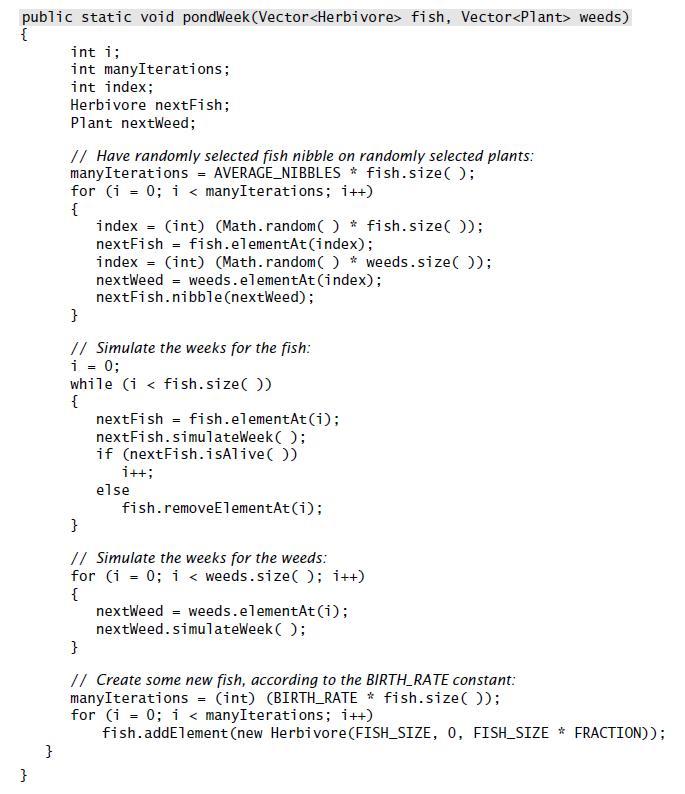
FIGURE 13.10 The Pond Life Simulation Java Application Program // FILE: PondLife.java // A simple simulation program to model the fish and weeds in a pond import edu.colorado.simulations.*; // Provides Organism, Plant, Herbivore classes import java.util.Vector; public class PondLife { // Number of weeds in the pond public static final int MANY_WEEDS = 2000; // Initial size of each weed, in ounces public static final double WEED_SIZE = 15; // Growth rate of weeds, in ounces/week public static final double WEED_RATE 2.5; // Initial number of fish in the pond public static final int INIT_FISH = 300; // Fish size, in ounces public static final double FISH_SIZE = 50; // A fish must eat FRACTION times its size during one week, or it will die. public static final double FRACTION = 0.5; // Average number of weeds nibbled by a fish over a week public static final int AVERAGE_NIBBLES = 30; // At the end of each week, some fish have babies. The total number of new fish born is the // current number of fish times the BIRTH_RATE (rounded down to an integer). public static final double BIRTH_RATE = 0.05; // Number of weeks to simulate public static final int MANY_WEEKS 38;
Step by Step Solution
3.33 Rating (174 Votes )
There are 3 Steps involved in it
import javaawt import javaappletApplet public class PondLifeApplet extends Applet private static fin... View full answer

Get step-by-step solutions from verified subject matter experts