

Assume the Black-Scholes framework. Which of the following graphs best represents the relationship between the delta of
Question:
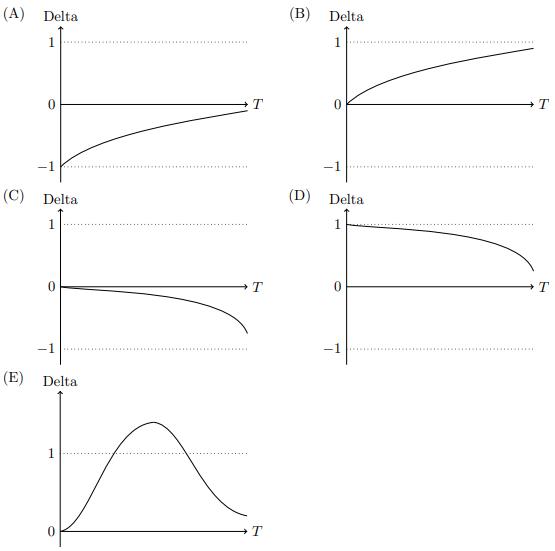
Assume the Black-Scholes framework. Which of the following graphs best represents the relationship between the delta of a deep out-of-the-money European call option on a nondividend-paying stock and the time to maturity T?
Fantastic news! We've Found the answer you've been seeking!
Step by Step Answer:
B The correct graph is B Delta of a plain vanilla European call is always bo...View the full answer

Answered By
Fahmin Arakkal
Tutoring and Contributing expert question and answers to teachers and students.
Primarily oversees the Heat and Mass Transfer contents presented on websites and blogs.
Responsible for Creating, Editing, Updating all contents related Chemical Engineering in
latex language
8+ Reviews
22+ Question Solved
Related Book For 

Question Posted:
