

Question: The table below presents the forward curve for a range of maturities. Fit the Nelson Siegel-Svensson model to this forward curve. t (in years) 1/12
The table below presents the forward curve for a range of maturities. Fit the Nelson Siegel-Svensson model to this forward curve.
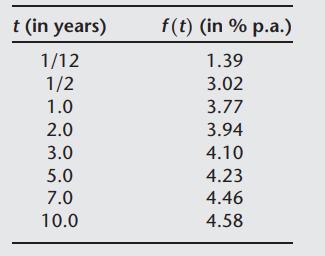
t (in years) 1/12 1/2 1.0 2.0 3.0 5.0 7.0 10.0 f(t) (in % p.a.) 1.39 3.02 3.77 3.94 4.10 4.23 4.46 4.58
Step by Step Solution
★★★★★
3.40 Rating (159 Votes )
There are 3 Steps involved in it
1 Expert Approved Answer
Step: 1 Unlock

Question Has Been Solved by an Expert!
Get step-by-step solutions from verified subject matter experts
Step: 2 Unlock
Step: 3 Unlock