

Question: A farmer weighed a random sample of pigs. The weights were summarised in a grouped frequency table and represented by a histogram. One of the
A farmer weighed a random sample of pigs. The weights were summarised in a grouped frequency table and represented by a histogram. One of the classes in the grouped frequency distribution was 28-32 and its associated frequency was 32. On the histogram the height of the rectangle representing that class was 2 cm and the width was 2 cm.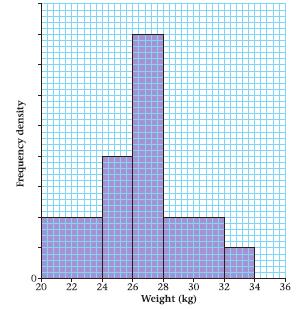
a Give a reason to justify the use of a histogram to represent these data. b Write down the underlying feature associated with each of the bars in a histogram. c Show that on this histogram each pig was represented by 0.125 cm. d How many pigs did the farmer weigh altogether? e Estimate the number of pigs that weighed between 25 and 29 kg.AppendixLO1
Frequency density 0+ 20 22 24 25 26 28 30 Weight (kg) 12: 32 34 36
Step by Step Solution
3.30 Rating (168 Votes )
There are 3 Steps involved in it

Get step-by-step solutions from verified subject matter experts