

Question: Exercise 6.10 showed a plot of length versus height for 147 male guppies with a least squares regression line. (a) Identify two points that have
Exercise 6.10 showed a plot of length versus height for 147 male guppies with a least squares regression line.
(a) Identify two points that have relatively high leverage and discuss whether these points seem to be particularly influential.
(b) Based on the plot, comment on whether it is appropriate to use \(R^{2}\) as a metric for describing the strength of the model fit.
(c) The \(R^{2}\) for this model is 0.718 . Interpret this value in the context of the data.
Data From Exercise 6.10
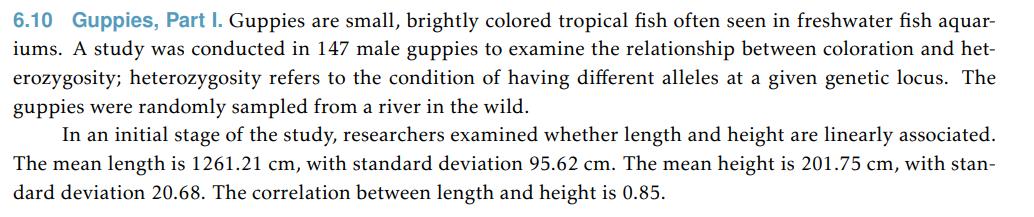
6.10 Guppies, Part I. Guppies are small, brightly colored tropical fish often seen in freshwater fish aquar- iums. A study was conducted in 147 male guppies to examine the relationship between coloration and het- erozygosity; heterozygosity refers to the condition of having different alleles at a given genetic locus. The guppies were randomly sampled from a river in the wild. In an initial stage of the study, researchers examined whether length and height are linearly associated. The mean length is 1261.21 cm, with standard deviation 95.62 cm. The mean height is 201.75 cm, with stan- dard deviation 20.68. The correlation between length and height is 0.85.
Step by Step Solution
3.41 Rating (148 Votes )
There are 3 Steps involved in it

Get step-by-step solutions from verified subject matter experts