

Question: Some students take part in an obstacle race. The time it took each student to complete the race was noted. The results are shown in
Some students take part in an obstacle race. The time it took each student to complete the race was noted. The results are shown in the histogram.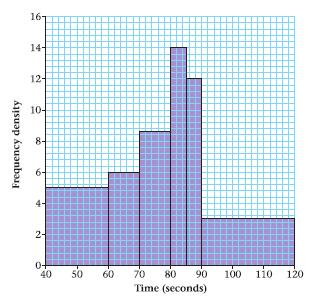
a Give a reason to justify the use of a histogram to represent these data. The number of students who took between 60 and 70 seconds is 90. b Find the number of students who took between 40 and 60 seconds. c Find the number of students who took 80 seconds or less. d Calculate the total number of students who took part in the race.
AppendixLO1
Frequency density 2 16- 14- 12 10- 0+ 40 50 60 70 80 90 100 110 120 Time (seconds)
Step by Step Solution
There are 3 Steps involved in it
1 Expert Approved Answer
Step: 1 Unlock

Question Has Been Solved by an Expert!
Get step-by-step solutions from verified subject matter experts
Step: 2 Unlock
Step: 3 Unlock