

Question: Plot the average bacteria counts for each solution in Problem 4-2 and compare them to a scaled t distribution. What conclusions can you draw? Problem
Plot the average bacteria counts for each solution in Problem 4-2 and compare them to a scaled t distribution. What conclusions can you draw?
Problem 4-2
Three different washing solutions are being compared to study their effectiveness in retarding bacteria growth in 5-gallon milk containers. The analysis is done in a laboratory, and only three trials can be run on any day. Because days could represent a potential source of variability, the experimenter decides to use a randomized block design. Observations are taken for four days, and the data are shown here. Analyze the data from this experiment (use α = 0.05) and draw conclusions.
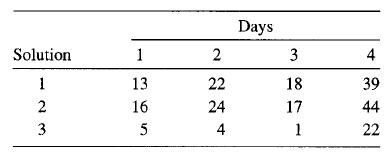
Days Solution 1 2 3 4 1 13 22 18 39 16 24 17 44 5 4 1 22 23
Step by Step Solution
3.42 Rating (161 Votes )
There are 3 Steps involved in it

Get step-by-step solutions from verified subject matter experts