

Question: Plot the factor effects from Problem 6-1 on a graph relative to an appropriately scaled t distribution. Does this graphical display adequately identify the important
Plot the factor effects from Problem 6-1 on a graph relative to an appropriately scaled t distribution. Does this graphical display adequately identify the important factors? Com-pare the conclusions from this plot with the results from the analysis of variance.
Problem 6-1.
An engineer is interested in the effects of cutting speed (A), tool geometry (B), and cutting angle (C) on the life (in hours) of a machine tool. Two levels of each factor are chosen, and three replicates of a 23 factorial design are run. The results follow:
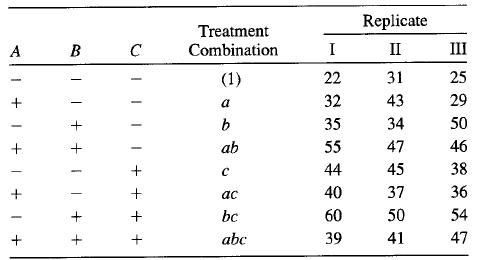
Replicate Treatment A B C Combination I II III (1) 22 31 25 a 32 43 29 35 34 50 + ab 55 47 46 44 45 38 ac 40 37 36 bc 60 50 54 + abc 39 41 47 UIII I + + + + ||| + + II + +
Step by Step Solution
3.29 Rating (158 Votes )
There are 3 Steps involved in it

Get step-by-step solutions from verified subject matter experts