Question: The data in Table 11-13 are input samples taken by an A/D converter. Notice that if the input data were plotted, it would represent a
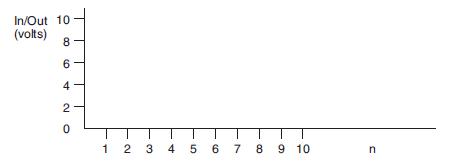
The data in Table 11-13 are input samples taken by an A/D converter. Notice that if the input data were plotted, it would represent a simple step function like the rising edge of a digital signal. Calculate the simple average of the four most recent data points, starting with OUT[4] and proceeding through OUT[10]. Plot the values for IN and OUT against the sample number n as shown in Figure 11-41.
Sample calculations:
![(IN[n OUT[n] OUT[4] (IN[1] OUT[5] = (IN[2] = - - 3] + IN[n 2] + IN[n + IN[2] + IN[3] + IN[3] + IN[4] 1] +](https://dsd5zvtm8ll6.cloudfront.net/images/question_images/1700/2/0/3/77165570cfb7aedb1700203772653.jpg)
(Notice that this calculation is equivalent to multiplying each sample by 1/4 and summing.)
Table 11-13
![Sample n IN[n] (V) OUT[n] (V) 1 0 0 2 0 0 3 0 0 4 0 5 10 6 10 7 10 8 10 9 10 10 10](https://dsd5zvtm8ll6.cloudfront.net/images/question_images/1700/2/0/3/61665570c60400201700203617527.jpg)
Figure 11-41

(IN[n OUT[n] OUT[4] (IN[1] OUT[5] = (IN[2] = - - 3] + IN[n 2] + IN[n + IN[2] + IN[3] + IN[3] + IN[4] 1] + IN[n])/4 = 0 + IN[4])/4 = 0 + IN[5])/4 = 2.5
Step by Step Solution
3.55 Rating (162 Votes )
There are 3 Steps involved in it

Get step-by-step solutions from verified subject matter experts


