

Question: a. Using Table 1.3, plot the inflation rate of Canada, France, Germany, Italy, Japan, and the United Kingdom against the United States inflation rate. b.
a. Using Table 1.3, plot the inflation rate of Canada, France, Germany, Italy, Japan, and the United Kingdom against the United States inflation rate.
b. Comment generally about the behavior of the inflation rate in the six countries vis-Ã -vis the U.S. inflation rate.
c. If you find that the six countries’ inflation rates move in the same direction as the U.S. inflation rate, would that suggest that U.S. inflation “causes†inflation in the other countries? Why or why not?
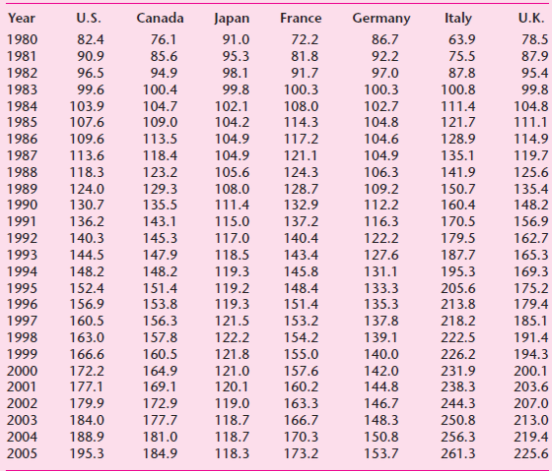
Subtract from the current year’s CPI the CPI from the previous year, divide the difference by the previous year’s CPI, and multiply the result by 100. Thus, the inflation rate for Canada for 1981 is [(85.6 − 76.1)/76.1] × 100 = 12.48% (approx.).
Canada Germany Italy U.K. Year U.S. Japan France 82.4 76.1 72.2 63.9 1980 91.0 86.7 78.5 81.8 91.7 1981 90.9 85.6 95.3 92.2 75.5 87.9 96.5 94.9 100.4 98.1 87.8 1982 97.0 95.4 1983 99.6 99.8 100.3 100.3 100.8 99.8 1984 103.9 104.7 102.1 108.0 102.7 111.4 104.8 109.0 111.1 1985 107.6 104.2 114.3 104.8 121.7 104.9 104.9 105.6 1986 109.6 113.5 117.2 104.6 128.9 114.9 1987 1988 113.6 121.1 135.1 118.4 104.9 119.7 118.3 123.2 124.3 106.3 141.9 125.6 108.0 111.4 124.0 130.7 128.7 132.9 137.2 109.2 112.2 150.7 160.4 1989 129.3 135.4 1990 135.5 148.2 1991 136.2 143.1 115.0 116.3 170.5 156.9 117.0 162.7 1992 140.3 145.3 140.4 122.2 179.5 144.5 148.2 118.5 127.6 131.1 165.3 169.3 1993 147.9 143.4 187.7 1994 148.2 119.3 145.8 195.3 119.2 1995 152.4 151.4 148.4 133.3 205.6 175.2 213.8 1996 156.9 153.8 119.3 151.4 135.3 179.4 1997 156.3 121.5 153.2 137.8 218.2 185.1 160.5 122.2 1998 163.0 157.8 154.2 139.1 222.5 191.4 1999 2000 2001 2002 166.6 160.5 121.8 155.0 140.0 142.0 144.8 226.2 231.9 238.3 244.3 194.3 172.2 177.1 121.0 164.9 157.6 200.1 203.6 207.0 169.1 120.1 160.2 179.9 172.9 119.0 163.3 146.7 2003 184.0 177.7 118.7 166.7 148.3 150.8 250.8 213.0 219.4 2004 118.7 170.3 256.3 188.9 181.0 153.7 2005 195.3 184.9 118.3 173.2 261.3 225.6
Step by Step Solution
3.36 Rating (180 Votes )
There are 3 Steps involved in it
a The graph of the inflation rates of the six countries plotted against the US inflation r... View full answer

Get step-by-step solutions from verified subject matter experts
Document Format (2 attachments)
1529_605d88e1ca328_656048.pdf
180 KBs PDF File
1529_605d88e1ca328_656048.docx
120 KBs Word File