

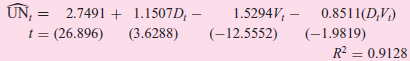
Consider the following regression results.* (The actual data are in the following table.) where UN = unemployment
Question:
where
UN = unemployment rate, %
V = job vacancy rate, %
D = 1, for period beginning in 1966€“IV
= 0, for period before 1966€“IV
t = time, measured in quarters
a. What are your prior expectations about the relationship between the unemployment and vacancy rates?
b. Holding the job vacancy rate constant, what is the average unemployment rate in the period beginning in the fourth quarter of 1966? Is it statistically different from the period before 1966 fourth quarter? How do you know?
c. Are the slopes in the pre- and post-1966 fourth quarter statistically different? How do you know?
d. Is it safe to conclude from this study that generous unemployment benefits lead to higher unemployment rates? Does this make economic sense?
Fantastic news! We've Found the answer you've been seeking!
Step by Step Answer:
a The relationship between the two variables is expected to be negativ...View the full answer

Answered By
Antony Mutonga
I am a professional educator and writer with exceptional skills in assisting bloggers and other specializations that necessitate a fantastic writer. One of the most significant parts of being the best is that I have provided excellent service to a large number of clients. With my exceptional abilities, I have amassed a large number of references, allowing me to continue working as a respected and admired writer. As a skilled content writer, I am also a reputable IT writer with the necessary talents to turn papers into exceptional results.
2+ Reviews
10+ Question Solved
Related Book For 

Question Posted:
