

Question: For the linear regressions in Table 9.3, compute the estimated effects, standard errors, and confidence intervals for a reduction of three students per class. Table
For the linear regressions in Table 9.3, compute the estimated effects, standard errors, and confidence intervals for a reduction of three students per class.
Table 9.3
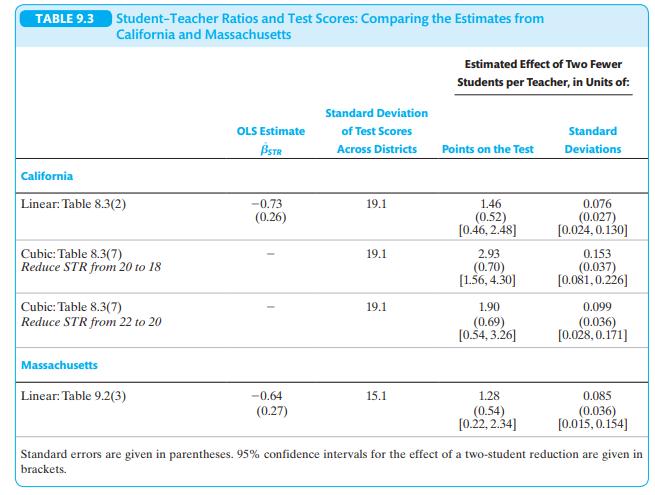
TABLE 9.3 Student-Teacher Ratios and Test Scores: Comparing the Estimates from California and Massachusetts California Linear: Table 8.3(2) Cubic: Table 8.3(7) Reduce STR from 20 to 18 Cubic: Table 8.3(7) Reduce STR from 22 to 20 Estimated Effect of Two Fewer Students per Teacher, in Units of: Standard Deviation OLS Estimate BSTR of Test Scores Across Districts Points on the Test Standard Deviations -0.73 (0.26) 19.1 19.1 2.93. (0.70) [1.56, 4.30] 19.1 1.90 1.46 (0.52) [0.46,2.48] 0.076 (0.027) [0.024, 0.130] 0.153 (0.037) [0.081,0.226] 0.099 (0.69) [0.54,3.26] (0.036) [0.028,0.171] Massachusetts Linear: Table 9.2(3) -0.64 (0.27) 15.1 1.28 (0.54) [0.22.2.34] 0.085 (0.036) [0.015, 0.154] Standard errors are given in parentheses. 95% confidence intervals for the effect of a two-student reduction are given in brackets.
Step by Step Solution
3.51 Rating (158 Votes )
There are 3 Steps involved in it

Get step-by-step solutions from verified subject matter experts