

Question: For the SAT example given in Exercise 2.16 do the following: In exercise Table 2.9 gives data on mean Scholastic Aptitude Test (SAT) scores for
In exercise
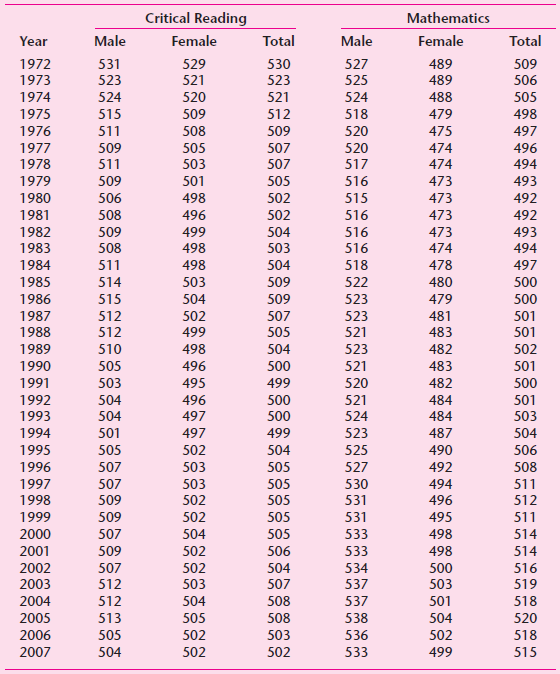
Table 2.9 gives data on mean Scholastic Aptitude Test (SAT) scores for collegebound seniors for 1972€“2007. These data represent the critical reading and mathematics test scores for both male and female students. The writing category was introduced in 2006. Therefore, these data are not included.
a. Plot the female reading score against the male reading score.
b. If the scatter plot suggests that a linear relationship between the two seems appropriate, obtain the regression of female reading score on male reading score.
c. If there is a relationship between the two reading scores, is the relationship causal?
Critical Reading Mathematics Total Total Male Female Male Female Year 531 523 529 521 1972 530 527 489 509 525 489 488 479 1973 523 506 1974 520 524 521 524 505 509 512 1975 515 518 498 520 1976 511 508 509 475 497 1977 520 517 474 474 496 494 509 505 507 511 507 1978 503 516 1979 509 501 505 473 493 1980 506 498 502 515 473 492 1981 473 473 508 496 502 516 492 1982 509 499 504 516 493 508 1983 498 503 516 474 494 478 1984 511 498 504 518 497 503 522 480 500 1985 514 509 1986 509 515 504 523 479 500 502 481 1987 512 507 523 501 1988 512 499 505 521 483 501 482 1989 510 498 504 523 502 505 483 501 500 1990 496 495 500 521 1991 503 499 520 482 504 1992 496 500 521 484 501 484 1993 504 497 500 524 503 504 506 497 1994 501 499 523 487 1995 505 502 504 525 490 527 530 1996 507 503 505 492 508 507 509 505 494 1997 503 511 1998 502 505 531 496 512 1999 509 502 505 531 495 511 533 2000 507 504 505 498 514 2001 498 514 516 519 509 502 506 533 2002 507 502 504 534 500 503 504 537 537 2003 512 507 503 2004 512 508 501 518 538 504 2005 513 505 508 520 2006 505 502 503 536 502 518 504 2007 502 502 533 499 515
Step by Step Solution
3.38 Rating (167 Votes )
There are 3 Steps involved in it
a See figure in Exercise 216 d In exercise The plot is ... View full answer

Get step-by-step solutions from verified subject matter experts
Document Format (2 attachments)
1529_605d88e1cb690_656132.pdf
180 KBs PDF File
1529_605d88e1cb690_656132.docx
120 KBs Word File