

Question: From the data given in the following table, find out the growth rate of expenditure on nondurable goods and compare your results with those obtained
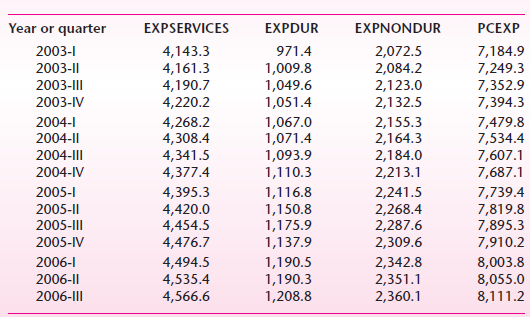
PCEXP Year or quarter EXPSERVICES EXPDUR EXPNONDUR 4,143.3 4,161.3 4,190.7 4,220.2 7,184.9 7,249.3 7,352.9 7,394.3 2003-1 971.4 2,072.5 2,084.2 2,123.0 2,132.5 2003-1| 1,009.8 1,049.6 1,051.4 2003-II 2003-IV 2004-1 4,268.2 4,308.4 4,341.5 4,377.4 1,067.0 1,071.4 1,093.9 1,110.3 2,155.3 2,164.3 2,184.0 2,213.1 7,479.8 7,534.4 7,607.1 7,687.1 2004-|| 2004-I| 2004-IV 2005-1 4,395.3 4,420.0 4,454.5 4,476.7 1,116.8 1,150.8 1,175.9 1,137.9 2,241.5 2,268.4 2,287.6 2,309.6 7,739.4 7,819.8 7,895.3 7,910.2 2005-1| 2005-1I|| 2005-IV 2,342.8 2,351.1 2,360.1 2006-I 4,494.5 4,535.4 4,566.6 1,190.5 1,190.3 1,208.8 8,003.8 8,055.0 8,111.2 2006-|| 2006-III
Step by Step Solution
3.52 Rating (169 Votes )
There are 3 Steps involved in it
The corresponding results for the nondurable goods sector ... View full answer

Get step-by-step solutions from verified subject matter experts
Document Format (2 attachments)
1529_605d88e1cd789_656223.pdf
180 KBs PDF File
1529_605d88e1cd789_656223.docx
120 KBs Word File