

Question: In Table 11.2, the estimated coefficient on black is 0.084 in column (1), 0.688 in column (2), and 0.389 in column (3). In spite of
In Table 11.2, the estimated coefficient on black is 0.084 in column (1), 0.688 in column (2), and 0.389 in column (3). In spite of these large differences, all three models yield similar estimates of the marginal effect of race on the probability of mortgage denial. How can this be?
Table 11.2
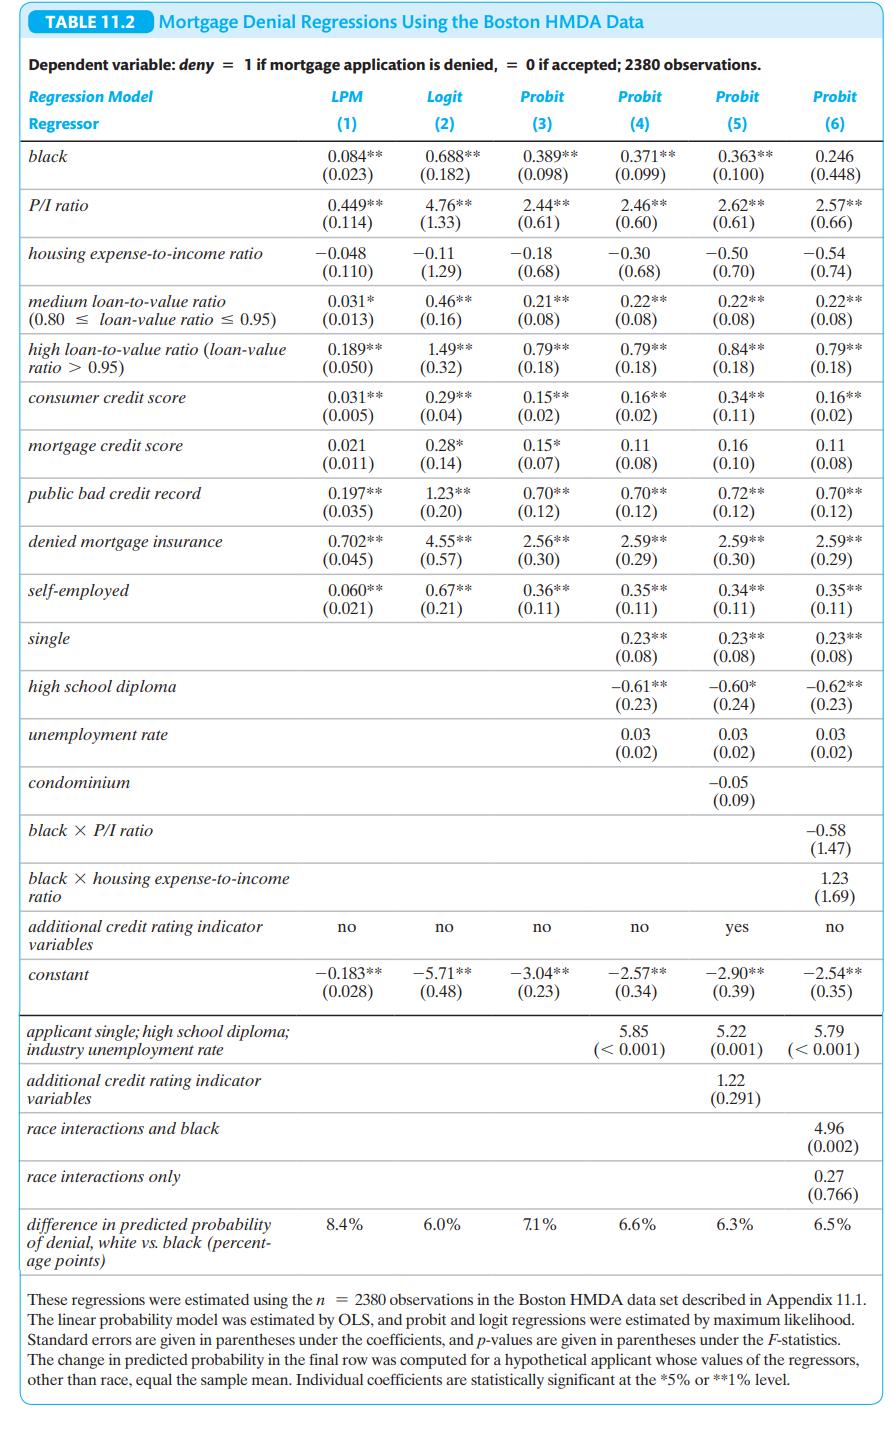
TABLE 11.2 Mortgage Denial Regressions Using the Boston HMDA Data Dependent variable: deny = 1 if mortgage application is denied, = 0 if accepted; 2380 observations. Regression Model Regressor black LPM Logit Probit Probit Probit Probit (1) (2) (3) (4) (5) (6) 0.084** 0.688** 0.389** 0.371** 0.363** (0.023) (0.182) (0.098) (0.099) (0.100) 0.246 (0.448) P/I ratio 0.449** 4.76** 2.44** 2.46** 2.62** 2.57** (0.114) (133) (0.61) (0.60) (0.61) (0.66) housing expense-to-income ratio -0.048 -0.11 -0.18 -0.30 -0.50 -0.54 (0.110) (1.29) (0.68) (0.68) (0.70) (0.74) medium loan-to-value ratio 0.031* 0.46** 0.21** 0.22** 0.22** 0.22** (0.80 loan-value ratio 0.95) (0.013) (0.16) (0.08) (0.08) (0.08) (0.08) high loan-to-value ratio (loan-value 0.189** 1.49** 0.79** 0.79** 0.84** 0.79** ratio > 0.95) (0.050) (0.32) (0.18) (0.18) (0.18) (0.18) consumer credit score 0.031** 0.29** 0.15** 0.16** 0.34** 0.16** (0.005) (0.04) (0.02) (0.02) (0.11) (0.02) mortgage credit score 0.021 0.28* 0.15* 0.11 0.16 0.11 (0.011) (0.14) (0.07) (0.08) (0.10) (0.08) public bad credit record 0.197** 1.23** 0.70** 0.70** 0.72** 0.70** (0.035) (0.20) (0.12) (0.12) (0.12) (0.12) denied mortgage insurance 0.702** 4.55** 2.56** 2.59** 2.59** 2.59** (0.045) (0.57) (0.30) (0.29) (0.30) (0.29) self-employed 0.060** 0.67** 0.36** 0.35** 0.34** 0.35** (0.021) (0.21) (0.11) (0.11) (0.11) (0.11) single 0.23** 0.23** 0.23** (0.08) (0.08) (0.08) high school diploma unemployment rate condominium -0.61** -0.60* -0.62** (0.23) (0.24) (0.23) 0.03 0.03 0.03 (0.02) (0.02) (0.02) -0.05 (0.09) black XP/I ratio -0.58 (1.47) black x housing expense-to-income ratio additional credit rating indicator variables 1.23 (1.69) constant applicant single; high school diploma, industry unemployment rate additional credit rating indicator variables no no no no yes no -0.183** (0.028) -5.71** (0.48) -3.04** (0.23) -2.57** (0.34) -2.90** (0.39) -2.54** (0.35) 5.85 (
Step by Step Solution
3.41 Rating (164 Votes )
There are 3 Steps involved in it
The differences in the estimated coefficients for black across the three models LPM Logit and Probit ... View full answer

Get step-by-step solutions from verified subject matter experts