

Question: Return to Exercise 1.7, which gave data on advertising impressions retained and advertising expenditure for a sample of 21 firms. In Exercise 5.11 you were
a. Interpret both models.
b. Which is a better model? Why?
c. Which statistical test(s) would you use to choose between the two models?
d. Are there €œdiminishing returns€ to advertising expenditure, that is, after a certain level of advertising expenditure (the saturation level), does it not pay to advertise? Can you find out what that level of expenditure might be? Show the necessary calculations.
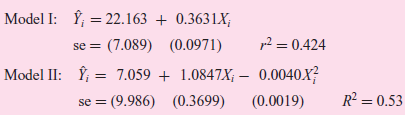
Model I: , = 22.163 + 0.3631X; se = (7.089) (0.0971) ; = 7.059 + 1.0847X; 0.0040X? = 9.986) (0.3699) p2 = 0.424 Model II: R = 0.53 (0.0019)
Step by Step Solution
3.39 Rating (161 Votes )
There are 3 Steps involved in it
a In Model I the slope coefficient tells us that per unit increase in the advertising expenditure on ... View full answer

Get step-by-step solutions from verified subject matter experts
Document Format (2 attachments)
1529_605d88e1d082b_656471.pdf
180 KBs PDF File
1529_605d88e1d082b_656471.docx
120 KBs Word File