

Question: Set up the ANOVA table in the manner of Table 5.4 for the regression model given in Eq. (3.7.2) and test the hypothesis that there
Set up the ANOVA table in the manner of Table 5.4 for the regression model given in Eq. (3.7.2) and test the hypothesis that there is no relationship between food expenditure and total expenditure in India.
Table 5.4
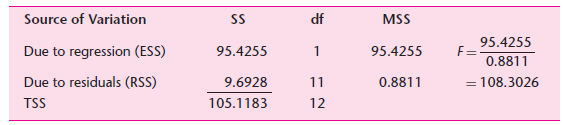
Eq (3.7.2)

Source of Variation MSS df SS 95.4255 Due to regression (ESS) 95.4255 1 95.4255 F= 0.8811 Due to residuals (RSS) TSS 9.6928 105.1183 = 108.3026 %3D 11 0.8811 12 FoodExp; = 94.2087 + 0.4368 TotalExp;
Step by Step Solution
3.30 Rating (156 Votes )
There are 3 Steps involved in it
ANOVA table for the Food Expenditure in India F 1390234470 311... View full answer

Get step-by-step solutions from verified subject matter experts
Document Format (2 attachments)
1529_605d88e1cc561_656184.pdf
180 KBs PDF File
1529_605d88e1cc561_656184.docx
120 KBs Word File