

Question: Table 2.10 presents data on mean SAT reasoning test scores classified by income for three kinds of tests: critical reading, mathematics, and writing. In Example
a. Refer to Figure 2.7 and prepare a similar graph relating average critical reading scores to average family income. Compare your results with those shown in Figure 2.7.
b. Repeat (a), relating average writing scores to average family income and compare your results with the other two graphs.
c. Looking at the three graphs, what general conclusion can you draw?
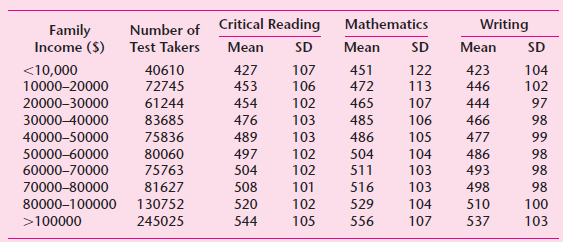
Mathematics Critical Reading Writing Number of Test Takers Family Income ($) Mean SD Mean SD Mean SD 107 423 100000 245025 544 105 556 107 537 103
Step by Step Solution
★★★★★
3.32 Rating (155 Votes )
There are 3 Steps involved in it
1 Expert Approved Answer
Step: 1 Unlock

a The scatter plot for male and female verbal scores is as follows The results a... View full answer
Question Has Been Solved by an Expert!
Get step-by-step solutions from verified subject matter experts
Step: 2 Unlock
Step: 3 Unlock
Document Format (2 attachments)
1529_605d88e1caaff_656098.pdf
180 KBs PDF File
1529_605d88e1caaff_656098.docx
120 KBs Word File