

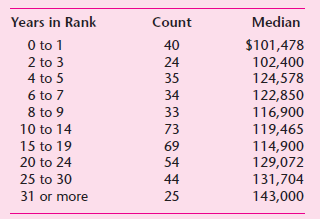
The following table gives data on median salaries of full professors in statistics in research universities in
Question:
a. Plot median salaries against years in rank (as a measure of years of experience). For the plotting purposes, assume that the median salaries refer to the midpoint of years in rank. Thus, the salary $124,578 in the range 4€“5 refers to 4.5 years in the rank, and so on. For the last group, assume that the range is 31€“33.
b. Consider the following regression models:
Yi = α1 + α2Xi + ui €¦€¦€¦€¦€¦€¦€¦. (1)
Yi = β1 + β2Xi + β3X2i + νi €¦€¦€¦€¦ (2)
where Y = median salary, X = years in rank (measured at midpoint of the range), and u and v are the error terms. Can you argue why model (2) might be preferable to model (1)? From the data given, estimate both the models.
c. If you observe heteroscedasticity in model (1) but not in model (2), what conclusion would you draw? Show the necessary computations.
d. If heteroscedasticity is observed in model (2), how would you transform the data so that in the transformed model there is no heteroscedasticity?
Step by Step Answer:
a As this figure shows median salary increases with years in rank but not perfectly linearly b From ...View the full answer


