

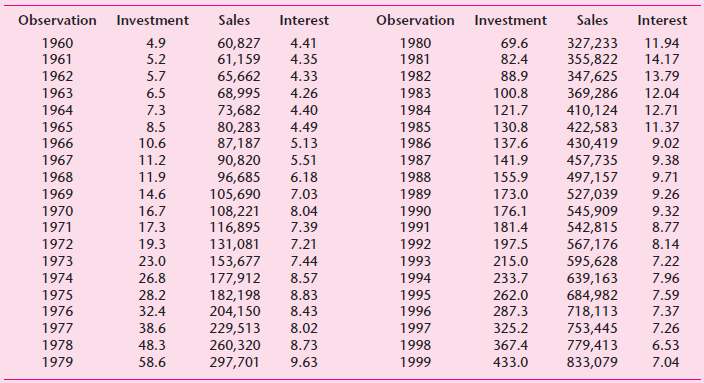
The following table gives data on private fixed investment in information processing and equipment (Y, in billions
Question:
a. Test for bilateral causality between Y and X2, paying careful attention to the lag length.
b. Test for bilateral causality between Y and X3, again paying careful attention to the lag length.
c. To allow for the distributed lag effect of sales on investment, suppose you decide to use the Almon lag technique. Show the estimated model, after paying due attention to the length of the lag as well as the degree of the polynomial.
Fantastic news! We've Found the answer you've been seeking!
Step by Step Answer:
a Direction of causality of lags F Probability Y X 2 2 00695 09329 X 2 Y 2 28771 00705 Y X 2 3 01338 ...View the full answer

Answered By
Srivatsan Bharadwaj
I like numbers, that is the reason why i chose accounting. I like this subject and it gives me immense pleasure to solve the problems associated with Accounting and finance. I have 2 years experience as private tutor.
0 Reviews
10+ Question Solved
Related Book For 

Question Posted:
