

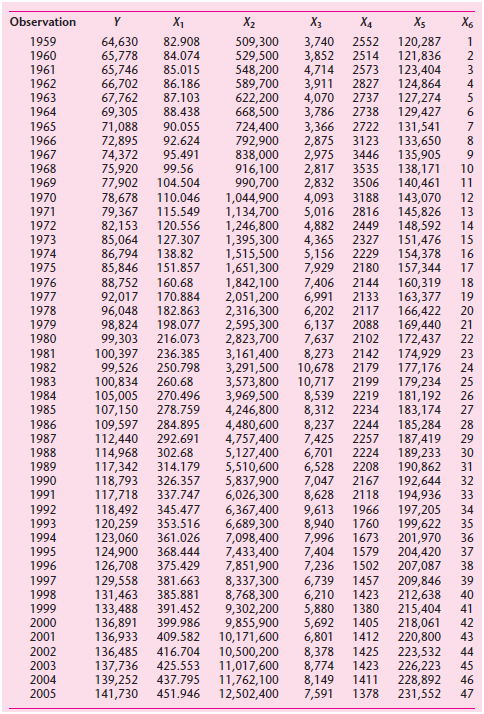
Question: Updated Longley data. We have extended the data given in Section 10.10 to include observations from 19592005. The new data are in the following table.
a. Create scatterplots as suggested in the chapter to assess the relationships between the independent variables. Are there any strong relationships? Do they seem linear?
b. Create a correlation matrix. Which variables seem to be the most related to each other, not including the dependent variable?
c. Run a standard OLS regression to predict the number of people employed in thousands. Do the coefficients on the independent variables behave as you would expect?
d. Based on the above results, do you believe these data suffer from multicollinearity?
Observation X1 X2 X3 X4 X5 X6 1959 1960 64,630 65,778 65,746 66,702 67,762 69,305 71,088 72,895 74,372 75,920 77,902 78,678 79,367 82,153 85,064 86,794 85,846 88,752 92,017 96,048 98,824 99,303 100,397 99,526 100,834 105,005 107,150 109,597 112,440 114,968 117,342 118,793 117,718 118,492 120,259 123,060 124,900 126,708 129,558 131,463 133,488 136,891 136,933 136,485 137,736 139,252 141,730 82.908 509,300 529,500 548,200 589,700 622,200 668,500 724,400 792,900 838,000 916,100 990,700 1,044,900 1,134,700 1,246,800 1,395,300 1,515,500 1,651,300 1,842,100 2,051,200 2,316,300 2,595,300 2,823,700 3,161,400 3,291,500 3,573,800 3,969,500 4,246,800 4,480,600 4,757,400 5,127,400 5,510,600 5,837,900 6,026,300 6,367,400 6,689,300 7,098,400 7,433,400 7,851,900 8,337,300 8,768,300 9,302,200 9,855,900 10,171,600 10,500,200 11,017,600 11,762,100 12,502,400 3,740 3,852 4,714 3,911 4,070 3,786 2552 120,287 121,836 123,404 2514 84.074 1961 85.015 2573 1962 86.186 2827 124,864 127,274 129,427 131,541 133,650 135,905 138,171 140,461 143,070 145,826 148,592 4 1963 87.103 2737 1964 88.438 2738 1965 90.055 3,366 2722 2,875 2,975 2,817 2,832 4,093 5,016 4,882 4,365 5,156 7,929 7,406 6,991 6,202 6,137 7,637 8,273 10,678 10,717 8,539 8,312 8,237 7,425 6,701 6,528 7,047 8,628 9,613 1966 8,940 7,996 7,404 7,236 6,739 6,210 5,880 5,692 6,801 8,378 8,774 8,149 7,591 1966 92.624 3123 1967 95.491 3446 9. 1968 99.56 3535 10 1969 104.504 3506 11 110.046 1970 3188 12 1971 1972 1973 115.549 2816 13 120.556 127.307 2449 14 2327 151,476 154,378 157,344 160,319 19 15 138.82 2229 1974 16 1975 151.857 2180 17 1976 1977 1978 160.68 2144 18 2133 170.884 163,377 166,422 21 182.863 2117 20 198.077 169,440 22 1979 2088 1980 216.073 2102 172,437 174,929 177,176 179,234 181,192 183,174 185,284 187,419 189,233 190,862 192,644 33 1981 236.385 2142 23 1982 250.798 2179 24 260.68 1983 2199 2219 25 1984 270.496 26 1985 278.759 2234 27 1986 284.895 2244 28 1987 292.691 2257 29 1988 302.68 2224 30 1989 314.179 2208 31 1990 326.357 337.747 2167 2118 32 1991 194,936 197,205 199,622 201,970 204,420 207,087 209,846 212,638 215,404 218,061 220,800 223,532 226,223 228,892 231,552 1992 345.477 34 1993 1994 1995 353.516 1760 35 361.026 1673 36 368.444 1579 37 1996 375.429 1502 38 1997 381.663 1457 39 1998 385.881 1423 1380 1405 1412 40 1999 391.452 41 399.986 409.582 2000 42 2001 43 2002 416.704 1425 44 2003 425.553 1423 45 2004 437.795 1411 46 2005 451.946 1378 47
Step by Step Solution
3.47 Rating (154 Votes )
There are 3 Steps involved in it
a Yes there definitely seems to be some strong relationships between several of the independent vari... View full answer

Get step-by-step solutions from verified subject matter experts
Document Format (2 attachments)
1529_605d88e1d30e4_656722.pdf
180 KBs PDF File
1529_605d88e1d30e4_656722.docx
120 KBs Word File