

Question: Using the data given in Exercise 17.22, determine whether plant expenditure Granger-causes sales or whether sales Granger-cause plant expenditure. Use up to six lags and
Data from exercise 17.22
Consider the following model:
Yˆ—i = α + β0Xt + ut
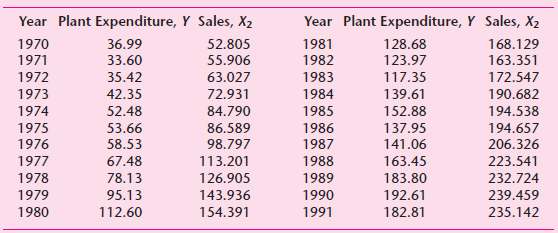
where Yˆ— = desired, or long-run, business expenditure for new plant and equipment, Xt = sales, and t = time. Using the stock adjustment model, estimate the parameters of the long- and short run demand function for expenditure on new plant and equipment given in the following table.
How would you find out if there is serial correlation in the data?
Year Plant Expenditure, Y Sales, X2 Year Plant Expenditure, Y Sales, X2 1970 36.99 52.805 1981 128.68 168.129 1971 33.60 55.906 1982 123.97 163.351 1983 63.027 172.547 1972 35.42 117.35 190.682 1973 42.35 72.931 1984 139.61 1974 52.48 84.790 1985 152.88 194.538 1975 53.66 86.589 1986 137.95 194.657 1976 58.53 98.797 1987 141.06 206.326 1977 67.48 113.201 1988 163.45 223.541 1978 78.13 126.905 1989 183.80 232.724 95.13 112.60 1979 143.936 1990 192.61 239.459 1980 1991 154.391 182.81 235.142
Step by Step Solution
3.36 Rating (168 Votes )
There are 3 Steps involved in it
Null hypothesis H0 sales do not Granger cause investment in plant and equipment The ... View full answer

Get step-by-step solutions from verified subject matter experts
Document Format (2 attachments)
1529_605d88e1e1c4d_666634.pdf
180 KBs PDF File
1529_605d88e1e1c4d_666634.docx
120 KBs Word File