The following shows the production possibilities for a plant that can manufacture iron or steel. Columns AD
Question:
The following shows the production possibilities for a plant that can manufacture iron or steel. Columns A–D show the number of tons of each metal that can be produced for each alternative.
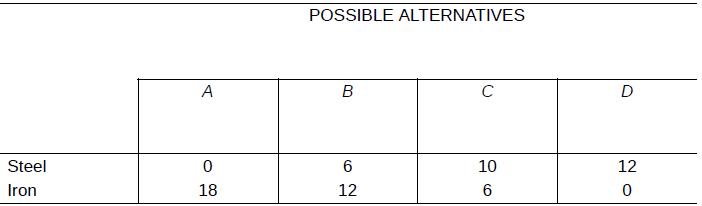
a. Draw the production possibility curve for this plant. Label the curve EE′. Does the curve show constant costs or increasing costs?
b. Suppose the firm increases steel production from Alternative B to Alternative C. What is the opportunity cost of each ton of steel in terms of iron? Suppose iron sold for $50 a ton. What would be the dollar opportunity cost of a ton of steel? Is this the minimum or maximum price the firm would have to charge in order to produce steel?
c. Suppose new technology allows the firm to produce twice as much steel as shown above but does not affect its iron production.
Draw the new production possibility curve and label it FF′. Will this raise or lower the opportunity cost of producing twelve tons of steel?
Step by Step Answer:
a The curve is shown below The curve shows increasing costs b By going ...View the full answer