

Get the monthly data from 1970 to 2009 on the M2 (gross) monetary aggregate (CANSIM series V41552796)
Question:
Get the monthly data from 1970 to 2009 on the M2 (gross) monetary aggregate (CANSIM series V41552796) from the Textbook Resources area of the MyEconLab.
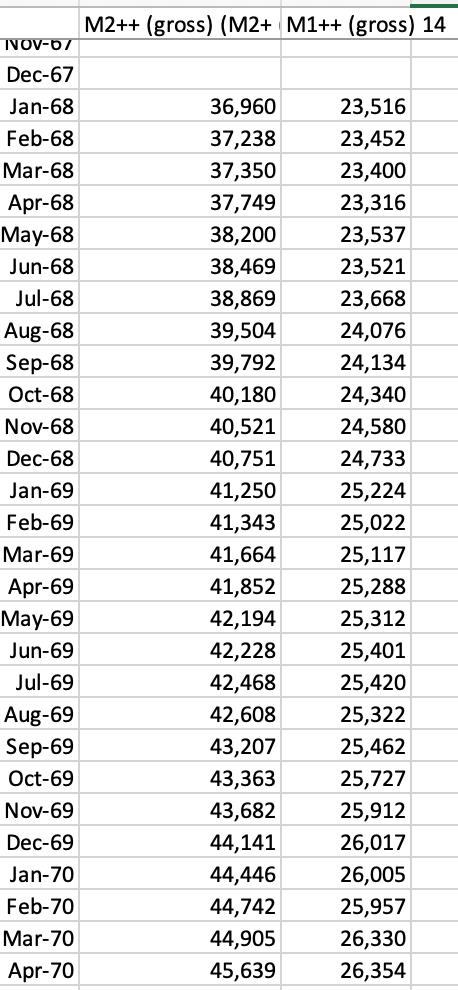
a. Calculate the money growth rate over the entire period and present a time series plot of the series (that is, graph the money growth rate series against time).
b. Calculate the average monetary growth rate and its standard deviation over each of the last four decades.
c. Which decade had the lowest money growth? The highest?
d. Which decade had the lowest money growth volatility? The highest?
Step by Step Answer:

This question has not been answered yet.
You can Ask your question!
Related Book For 
The Economics Of Money Banking And Financial Markets
ISBN: 9780321584717
4th Canadian Edition
Authors: Frederic S. Mishkin, Apostolos Serletis
Question Posted:
